I’m excited to share my next project with y’all:
I’ve downloaded the box scores for every Nationals game since USAU started keeping box scores in 2014—11 years, 3 divisions, 1,779 (ish)1 games. By putting these together in a database, we can explore the greatest games, greatest years, and greatest careers at Nationals2.
I’ve also included the full-tournament stat sheets from the 2013 tournament (available here, per-game box scores are not available as far as I know) along with the 2013 results (taken from here) to add 2013 to the full-year and full-career analyses.
I’m not aware of a project like this that already exists. At least, I’ve never seen it myself, nor have I seen Ultiworld use career stats in their ‘best player of the decade’ articles or the Ultimate Hall of Fame in their messaging.
Click here to access the updated full data via Google Sheets. [Note: Click “Data”→ “+ Create Filter View” and you’ll be able to filter the data the way I’ve done in tables below.]
The data definitely isn’t perfect but in my opinion it’s still worth sharing—some further notes and known errors are at the end of the post. Feel free to get in touch if you find an error in the data or just find something cool you think I should add to the post.
[Update (2026-04-22)]:
A bunch of minor updates have been made to this post. For the details, see Update on Career Nationals Stats.
[Update (2026-04-23)]:
I manually changed two more names in the 2013 stats file to integrate with players’ current USAU names (other changed names listed in the notes):
Nicky Spiva -> Nick Spiva
Georgia Bosscher->Georgia Shriwise
Updated three tables (Career assists, career +/-, list of players to play all 12 Nationals) with the new updates to Nick Spiva’s stats.
[Update (2026-02-23)]: [I’ve removed the details of this update as they’re now fully integrated into the post below, and described in more detail in the update post.]
With that said, let’s go:
Single game standouts
Here are some of the standout single game performances in Nationals history:
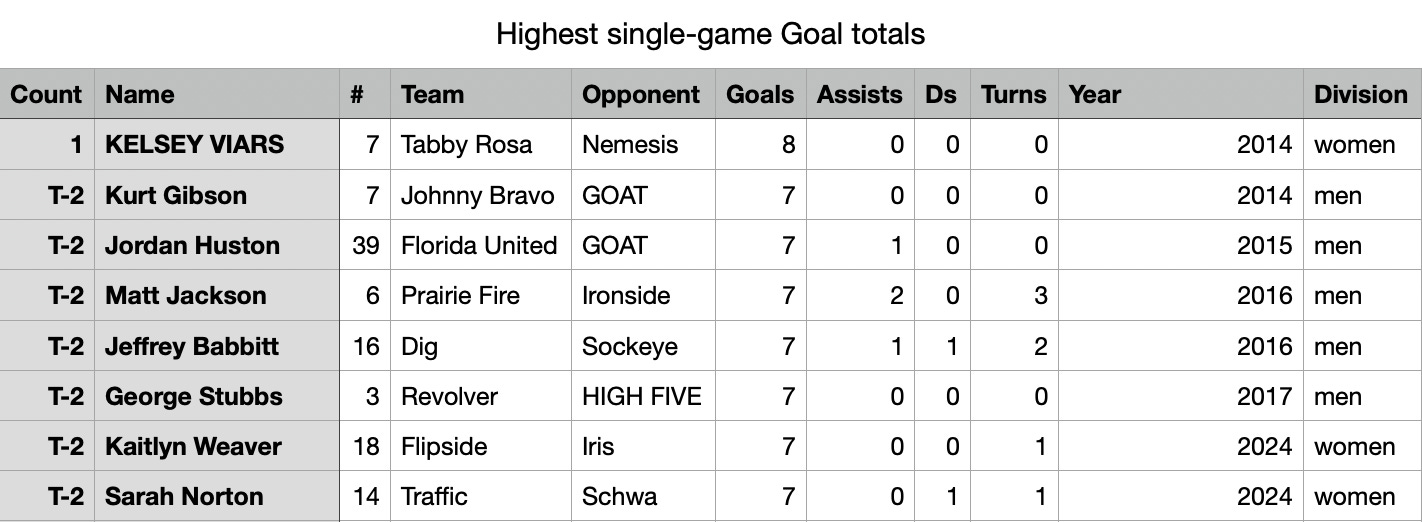
Kelsey Viars of 2014 Tabby Rosa stands alone as the only player to record 8 goals in a single game.
Seven other players have scored 7 goals in a single game, 5 in the Men’s division and 2 in Women’s (never happened in Mixed—is there a reason for that?).
A 6-goal game has happened 28 times, twice by Sandy Jorgensen and once by Kaitlyn Weaver (who’s already on the list above as a 7-goal scorer).
Kurt Gibson’s 7-goal game happened in 2014 semifinals. I believe every other game on the list happened in Prequarters or earlier.
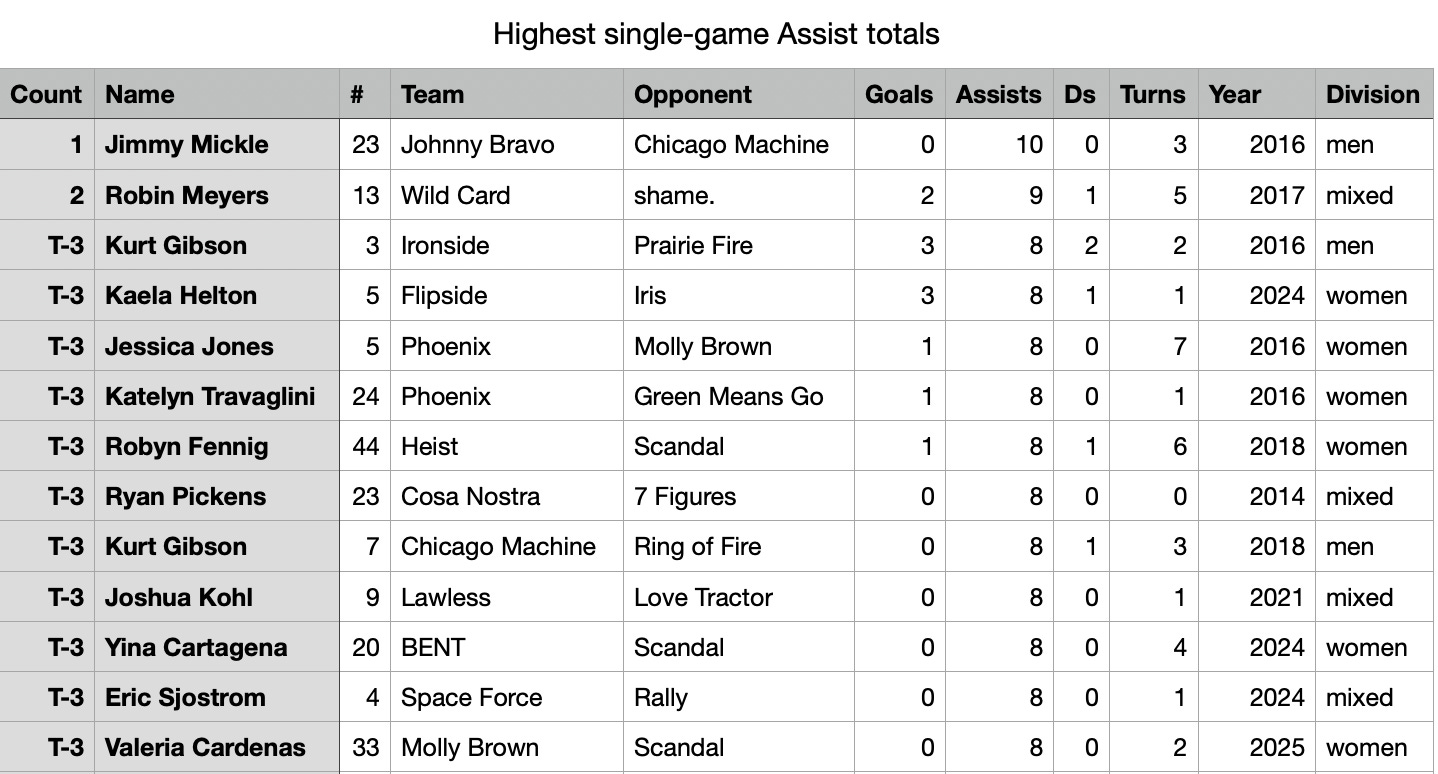
Jimmy Mickle of 2016 Johnny Bravo stands alone as the only player to record 10 assists in a game.
Robin Meyers (2017 Wild Card) hit 9 assists in a game. 11 others have recorded 8 assists in a game, including Valeria Cardenas at the most recent Nationals.
I believe none of these games happened any later than Prequarters.
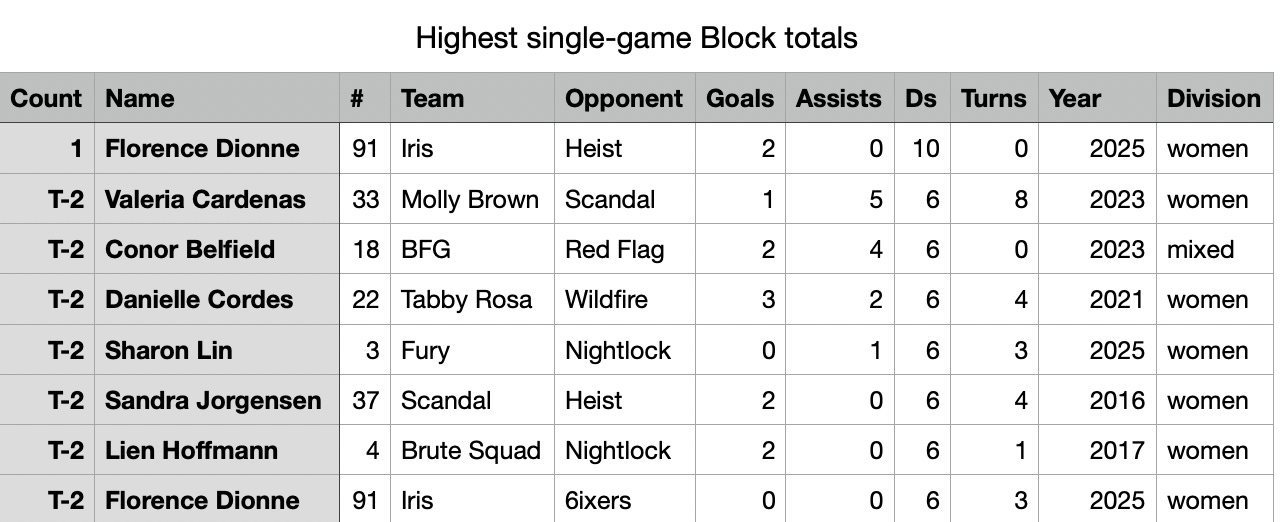
I have to express some doubts here…I really want the Florence Dionne 10-block game to be real…But it’s hard to believe it really happened. No one else has ever recorded more than 6 blocks in a game. But she’s got this 10-block game in 2025 Nationals, another 6-block game in the same Nationals, and 0 blocks in any of her other Nationals games that year. (And only 2 blocks in 2024 Nationals).
My heart wants to believe…but my mind is doubtful. Pretty much every elite team is filming all their games nowadays. Someone must be able to find out whether this statline truly happened or not.Outside the top spot, 7 players are tied with 6 blocks in a game. There are 18 instances of 5-block games (Twice by Opi Payne).
It appears Conor Belfield is the only man-matching player to ever get 6 blocks in a game. Perhaps unsurprisingly, he was the mixed division DPOY that year. (In line with the note I made at the start of this post, the DPOY article doesn’t even mention that he had one of the best single-game performances of all time!)
Not shown in the image: shout out to DiG’s Gus Haflin, the only player in the Men’s division to have a recorded 5-block game (or more). Every other 5- or 6-block game happened in Women’s or Mixed.
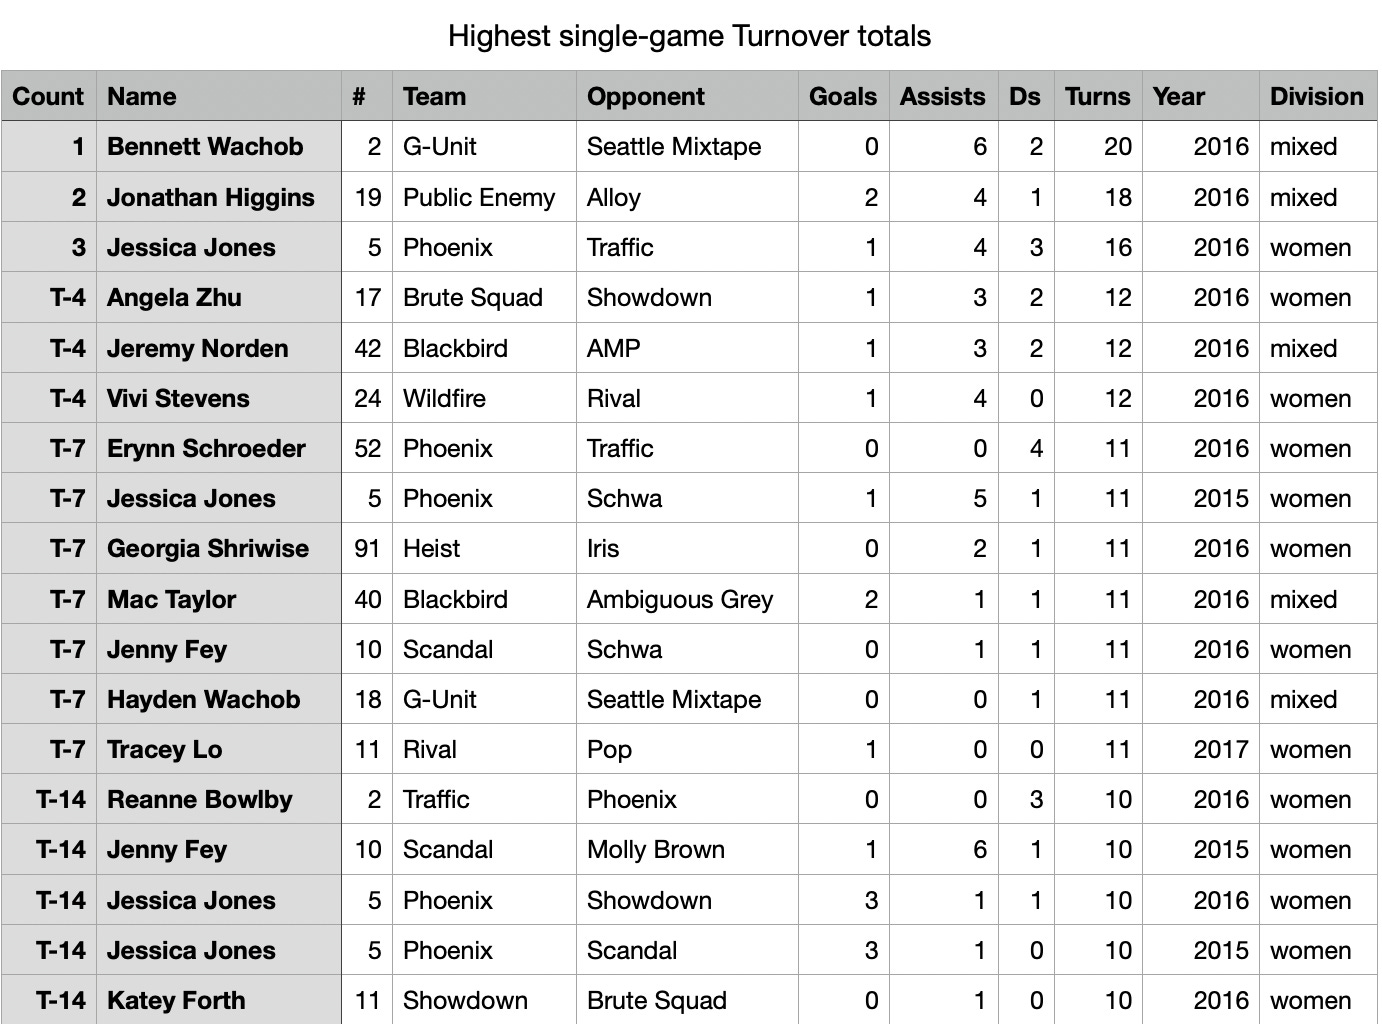
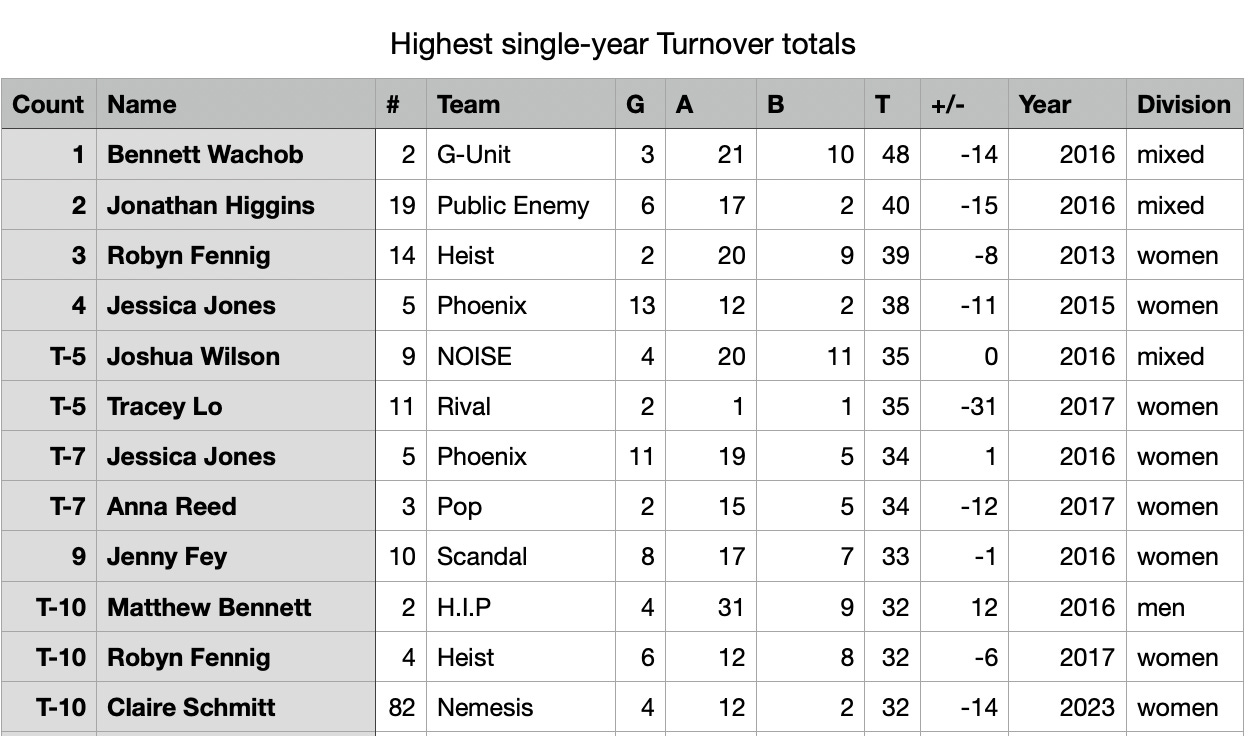
Above are all the instances of a double-digit turnover game. (Updated on 2026-04-20 to add 2015 Jenny Fey vs. Molly Brown, see updates post.)
The vast majority on this list are from 2016 (Rockford, IL), with a few from 2015 (Frisco, TX) or 2017 (Sarasota, FL). You think it might’ve been windier at those tournaments than it is near San Diego?? There are some 9-turnover games in the post-COVID era, though.
No shade meant towards any of these players. Sometimes a team’s rational best shot at winning is to have your best thrower take a bunch of risky shots (plus the already mentioned wind factor).
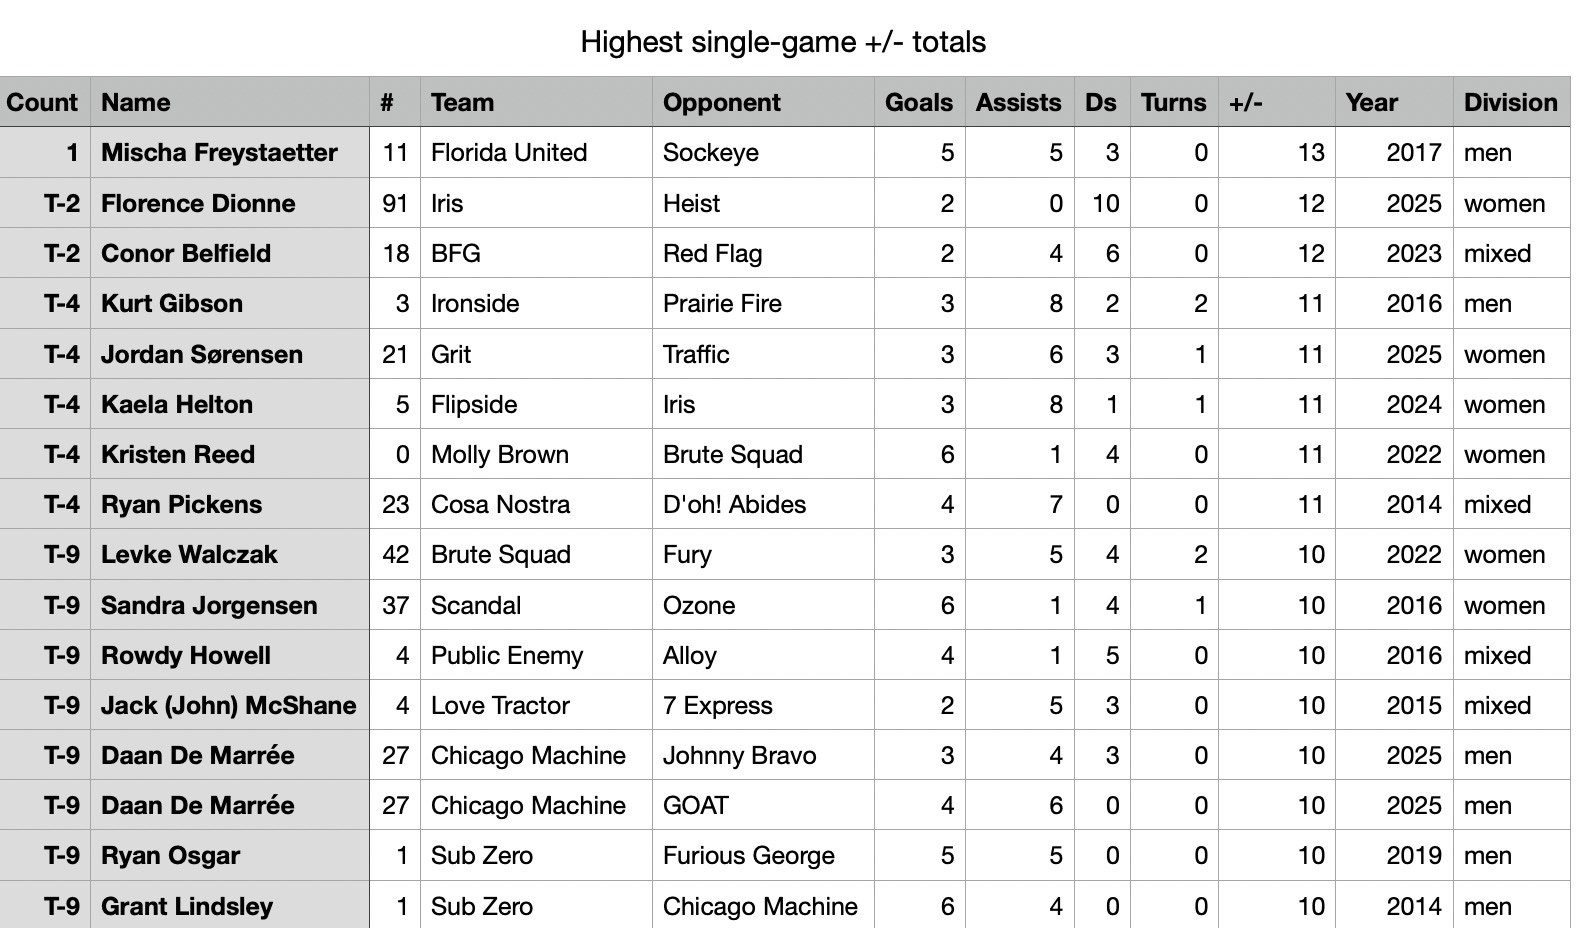
Mischa Freystaetter stands alone with a +13 game at 2017 Nationals. The image includes all the double-digit plus/minus games.
Florence Dionne’s game is discussed in Blocks section above.
Daan De Marree shows up twice on this list, with two +10 games from 2025 Nationals alone! We’ll see more from him later.
I believe the only game on this list that happened in semis or later was Levke Walczak’s 2022 game against Fury.
Not shown: 13 players have put up a +9 game, including repeat appearances on the list from Mischa, Daan, Levke, and Sandy Jorgensen.
Levke’s 2025 Finals performance of 5 goals / 4 assists / 4 blocks / 5 turns leaves her next on the list at +8, the highest ever in a finals game. (If there was a stat just called “plus” that didn’t subtract turnovers, this would be one of the three games ever at +13, along with Mischa’s and Kurt Gibson’s games in the image above.)
Single year standouts
Highlights of players who had a great year at Nationals:
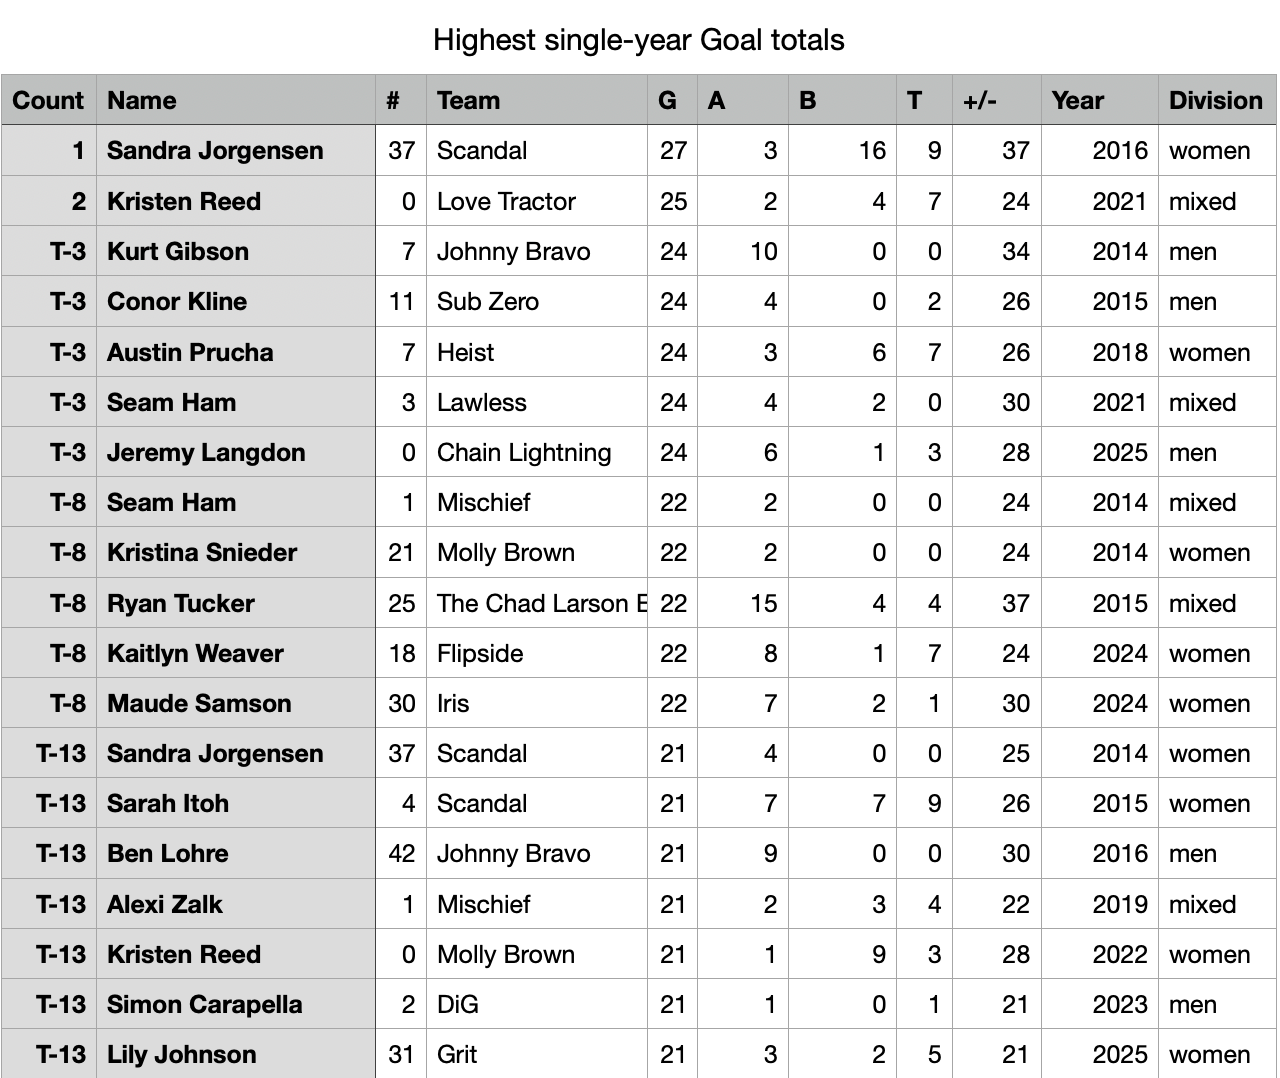
Sandy Jorgenson (2016 Scandal) stands a head above the rest with 27 goals. She, Kristen Reed (Love Tractor/Molly Brown) and Sean Ham3 (Mischief/Lawless) are the only players to score more than 20 goals at Nationals multiple times.
This image is every Nationals performance of more than 20 goals. Not shown: there are 14 more cases of an exactly 20-goal nationals, including twice by Sarah Norton of Traffic.
(Update on 2026-04-20: Sarah Itoh’s 21-goal 2015 performance with Scandal was added to this list with the new data included, see update post.)
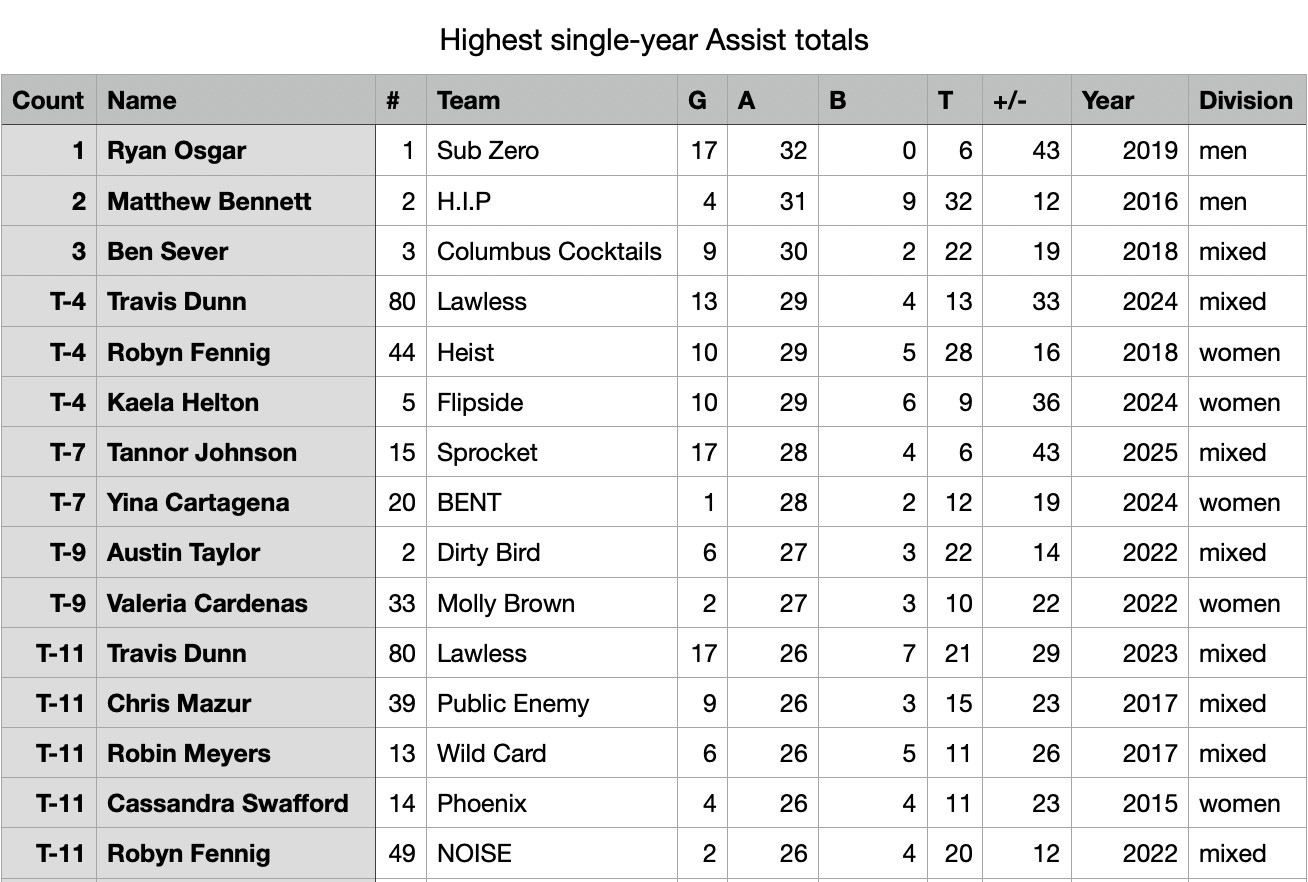
Ryan Osgar (2019 Sub Zero) is the single-year assist king, with 32 in 2019. Two other players have also crossed the 30 mark. Osgar also did it while tying for the fewest turnovers on this list (6 turns). 2022 was also the year he went 95% on 21 hucks in the UFA, so he was absolutely on one that year, throwing a frisbee in a way perhaps no one else ever has.
The image shows all instances of more than 25 assists at Nationals. Only two players have done it twice: Robyn Fennig (Heist, NOISE) and Travis Dunn (Lawless). We’ll see more from them below.
(Updated 2026-04-20: Cassandra Swafford’s 26-assist 2015 performance now included.)
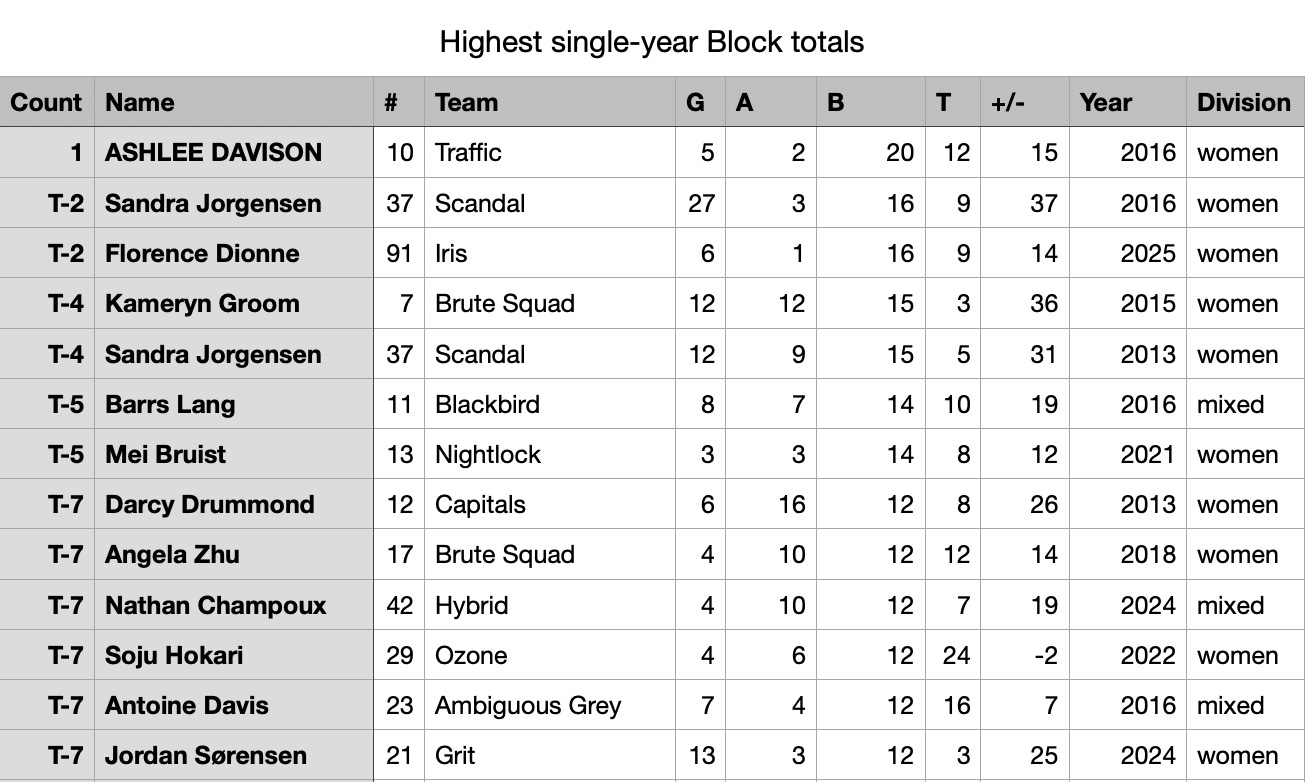
Ashlee Davison (2016 Traffic) tops the blocks list with 20 blocks in a single Nationals.
Sandy Jorgensen got 15+ blocks at Nationals twice. I believe the next closest person to that record is Nathan Champoux, who’s done 11+ blocks twice (12 in 2024, see above, and 11 blocks in 2022). Kami Groom has done 10+ blocks twice (with 10 in 2023).
Honestly this list has a higher % of people I’ve never heard of than any other list we’ve seen so far.
Jordan Sorensen shows up for the 2nd time (see single game +/- list). She’s really exploded onto the scene in the past couple years.
(Updated 2026-04-20: Now including Kami Groom’s 15-block 2015 tournament)
Sorting by Blocks also makes it easy to pick out players who’ve put together what you might call a “triple double”—10 or more goals, assists, and blocks at a single Nationals. I believe these are the only three players to ever record a Nationals triple-double:
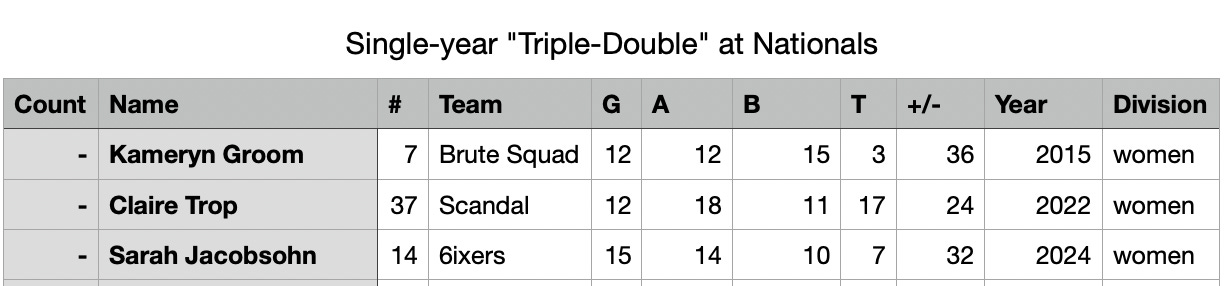
It’s somehow fitting that each of these three players had the most of each triple double stat (Goals, Assists, Blocks).
Kami Groom’s triple double wasn’t included in the original version of this post, but we now have the data—see updates post.
A few players have come tantalizingly close to the triple double. Here are all the times a player was one stat point away. This table is picked out by hand so it’s possible I missed someone:

Ben Jagt is the only Men’s division player to come within one stat of a triple double.
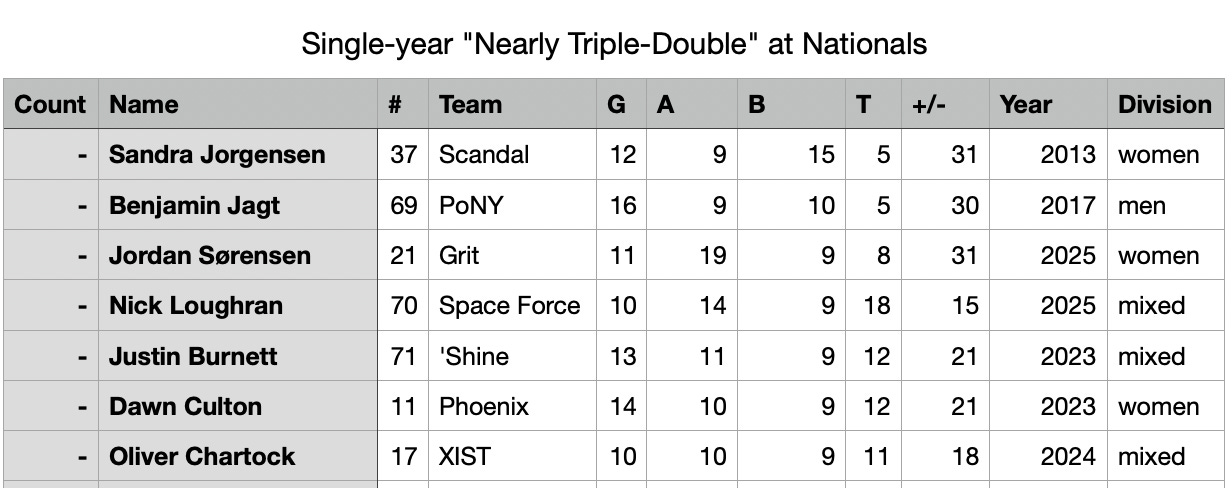
As mentioned above, 2015/2016/2017 was a very different environment from the more recent Nationals.
Yina Cartagena (2023 BENT, 29 turns) is the only other player anywhere near the top of the list from within the past few years (2022 onwards).
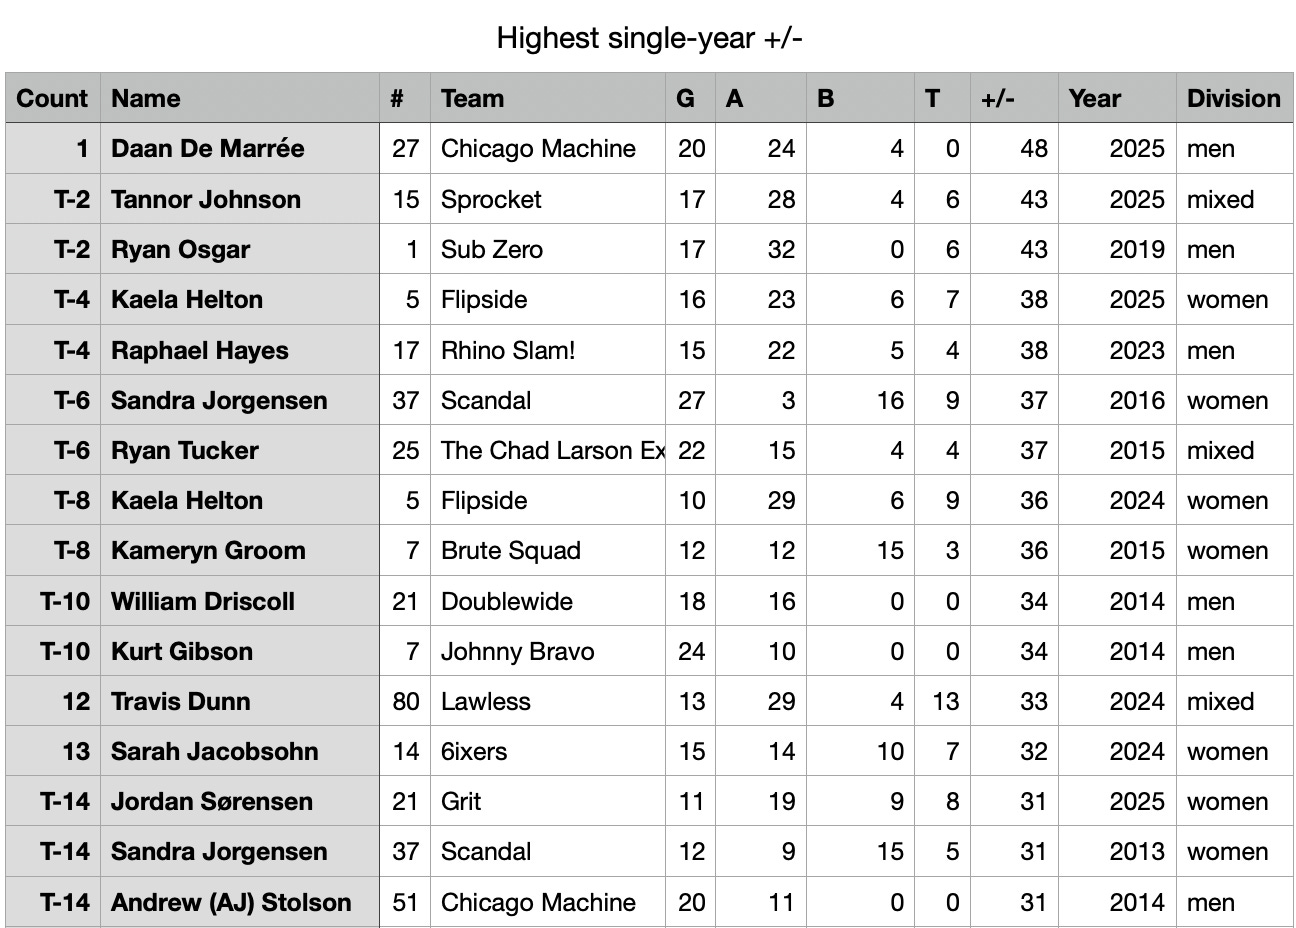
It’s pretty hard to argue against the claim that Daan De Marree’s 2025 tournament was the most complete frisbee we’ve ever seen. A +/- of 48 on zero turnovers—in over 14,000 player-years, we’ve never seen another +/- over 43. No one else with 20 goals has ever put up more than 15 assists in the same tournament—he had 24!
The list above has all the years of +/- over 30. It’s full of names we’ve already talked about: Daan, Osgar, Sandy, Kurt Gibson, Travis Dunn, Sarah Jacobsohn, Jordan Sorensen, etc.
Kaela Helton and Sandy Jorgensen are the only players to put up a +/- above 30 multiple times.
(Update 2026-04-20: Kami Groom’s 2015 now included on this list after being missing from the original post)
I wanted to include dominant single year teams here, ranked by point differential at Nationals, but for reasons discussed in the notes below, I believe my data currently isn’t good enough to actually give an accurate list for that. I’m pretty sure that the most dominant team ever in terms of point differential is 2021 Fury at +53. No team in pool play scored more than 4 goals on them.
The original version of this post didn’t include a section for best team point differential because of the data issues (see update post). I now feel reasonably confident that the data is at least pretty good, so here is the best single-year teams in terms of point differential:
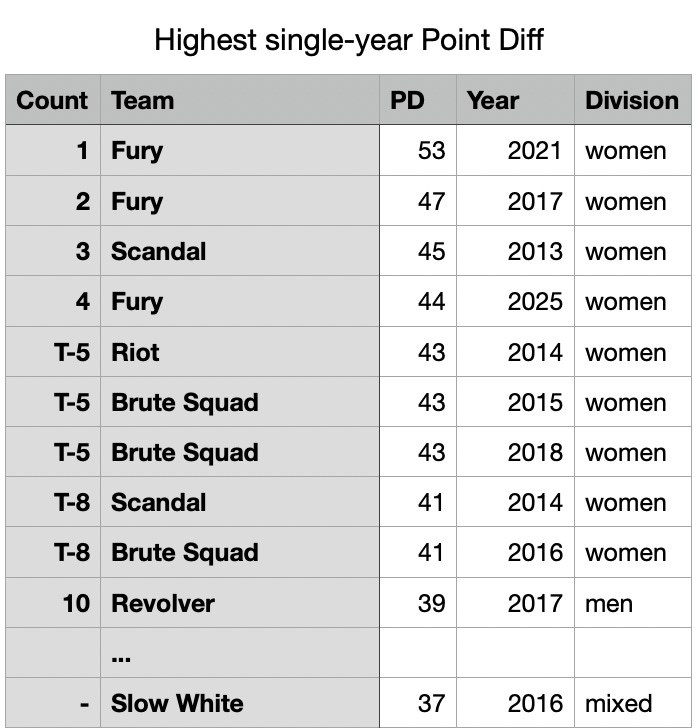
The most dominant team ever in terms of point differential is 2021 Fury at +53. No team in pool play scored more than 4 goals on them.
2017 Revolver is the most dominant men’s team, while 2016 Slow White is the most dominant mixed division team. (I skipped a few other teams to include Slow White on the list, hence why the bottom of the table looks the way it does.)
2013 Scandal is the data point I’m least confident about b/c game scores were taken from a separate source, see the explanation at the very top of this post.
2025 Fury at +44 has the highest point differential while losing a game—they lost 15-12 to Brute Squad in the final.
Career standouts — totals
Some of the best careers at Nationals:
[The inclusion of more 2015 women’s data means many small changes to these tables compared to when this article was first posted]
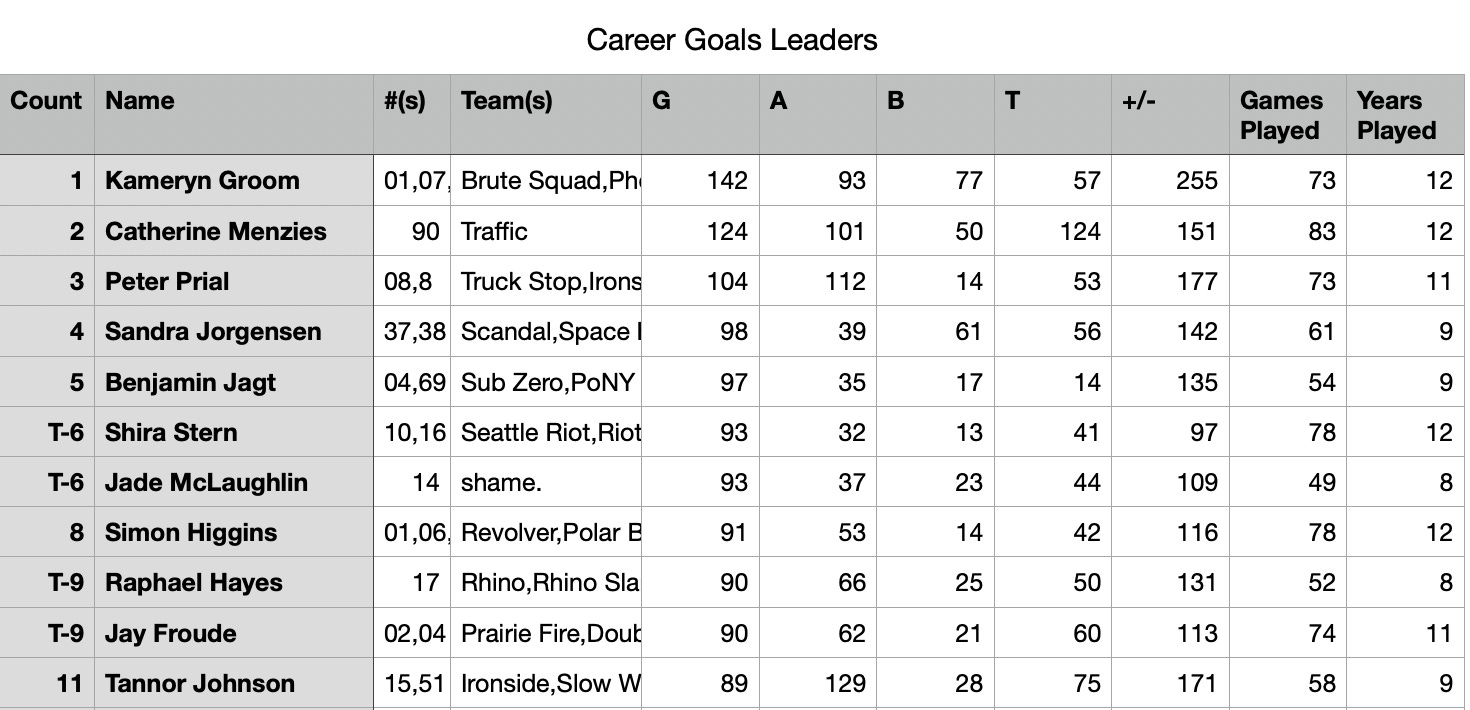
Kami Groom is on top for goals, and it’s not even close.
Catherine Menzies and Peter Prial are the only other two players with over 100 career goals. (Sandy Jorgensen surely does too if we had been able to include years before 2013.)
They’re also the only players with a career “double-triple”—triple digits in two categories (goals and assists). Tannor Johnson seems like a lock to reach that milestone as well if he keeps playing. Kami Groom can as well by keeping up her average assist production for another 1-2 years.
Not shown but worth noting: Ella Juengst is at 15th on the list with 79 goals. It may seem not that impressive when you see she’s played at Nationals 8 times…but that’s only if you don’t know she was still playing for UNC in college in 2023!
If she stays healthy and stays interested in frisbee, she’s basically a lock to end up at the top of this list (with Tannor Johnson). She had 4 goals combined at her first two Nationals4, but has averaged 12.5 per year since then (and, again, she theoretically hasn’t even reached her prime yet).The inclusion of more 2015 women’s data added goals for Groom, Menzies, Jorgensen, and Stern (the latter two also jumped up a few places in the ranking).
It’s interesting to see how Catherine Menzies has played 10 more Nationals games than Kami Groom over the years (due to Menzies’s teams ending up in consolation brackets while Groom’s teams almost always make deep bracket runs. That’s more than one tournament’s worth of games, it’s like she had an extra year to rack up stats. (In fact, Menzies and her teammate Jessica Rockliff are tied for the most games played in the database.)
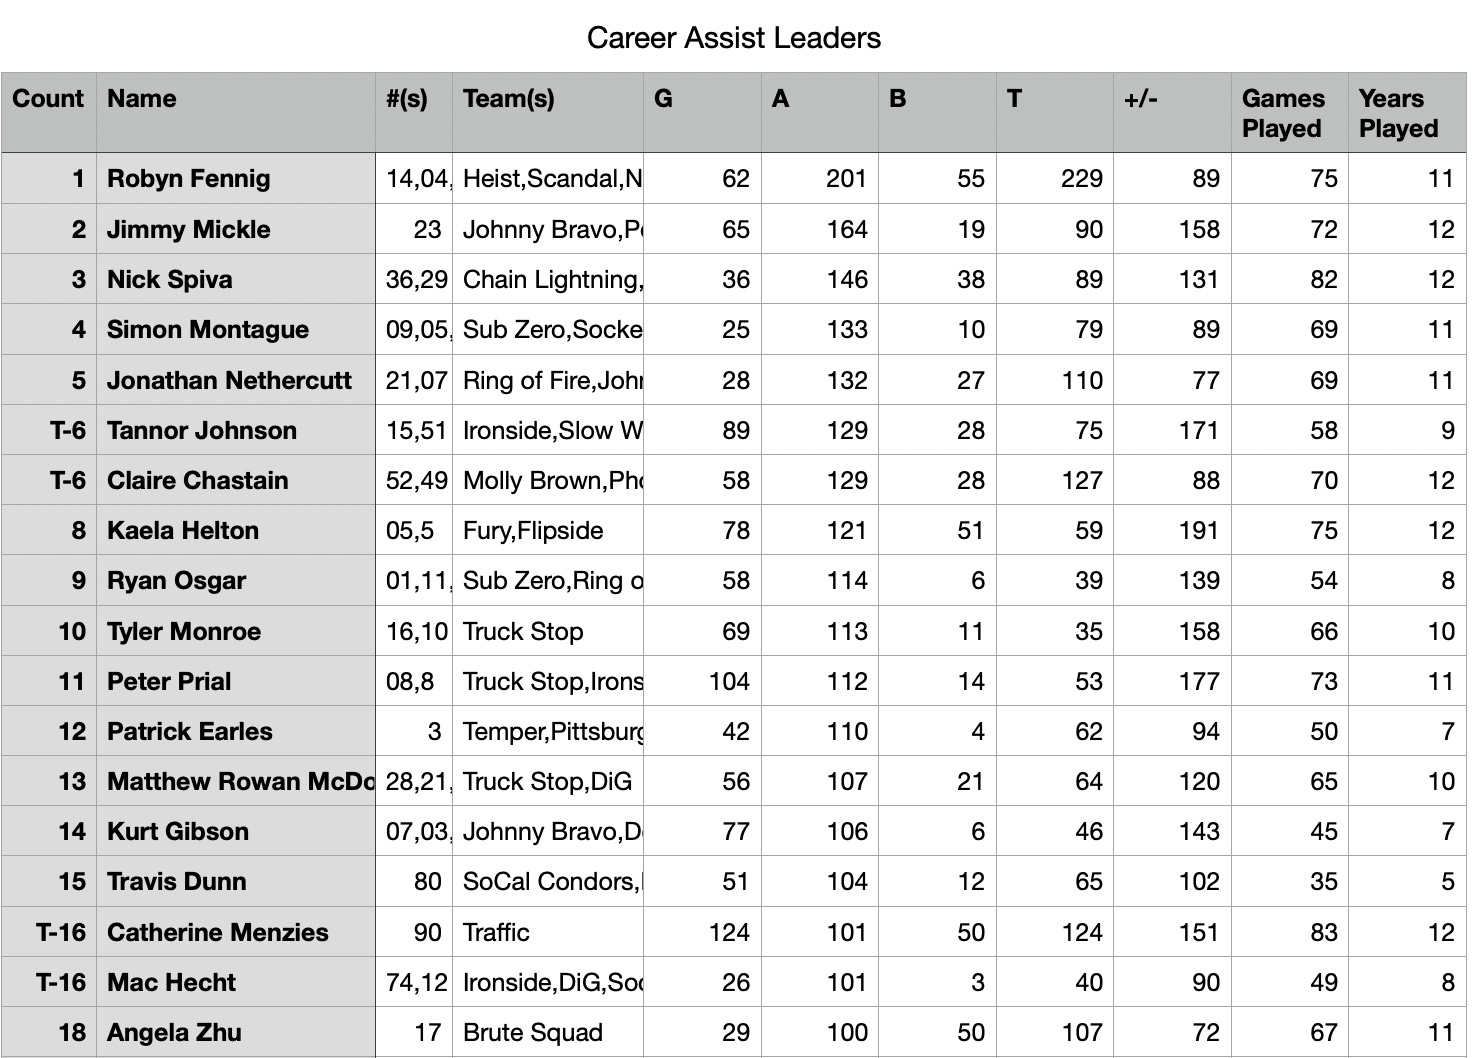
Robyn Fennig tops the list for assists, and again it’s not especially close. With 2015 women’s data fixed, she’s now the only player with over 200 career assists.
Tannor Johnson is quickly climbing up the career assists leaderboard as well. Ulti-verse has him still on the UMass roster in 2020, so he’s likely the youngest person on this list by a healthy amount. If he stays healthy, he’s almost certainly on track to someday have the most total Nationals stats of any player.
The career assists leaderboard skews heavily towards men-matching players — only 5 of the top 18 career assist-getters have played in the Women’s division.
The table includes all 18 players with 100 or more career assists.
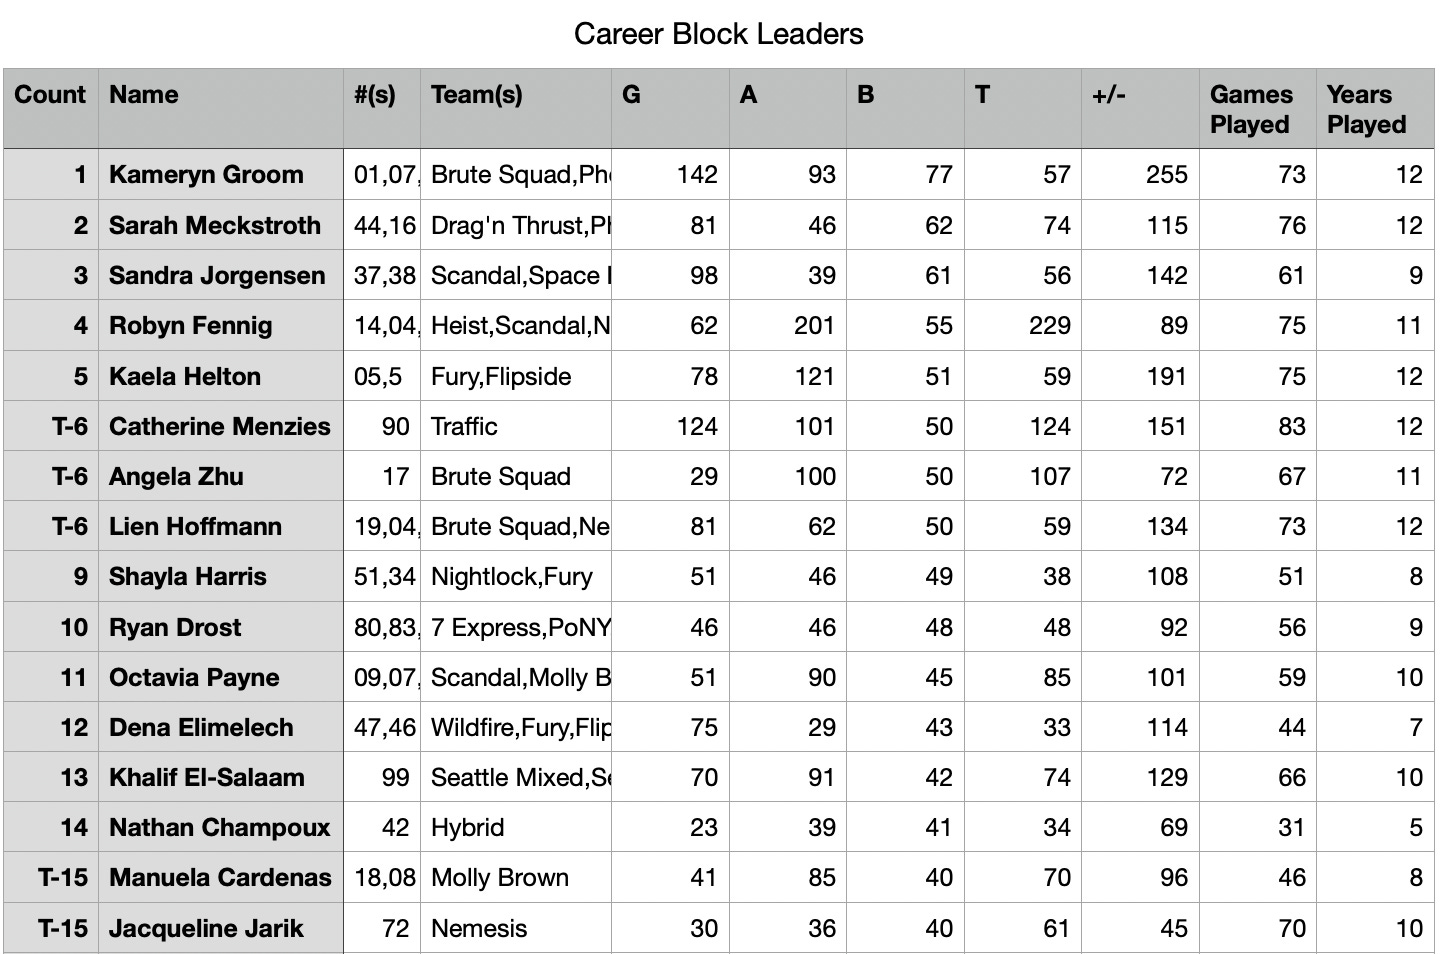
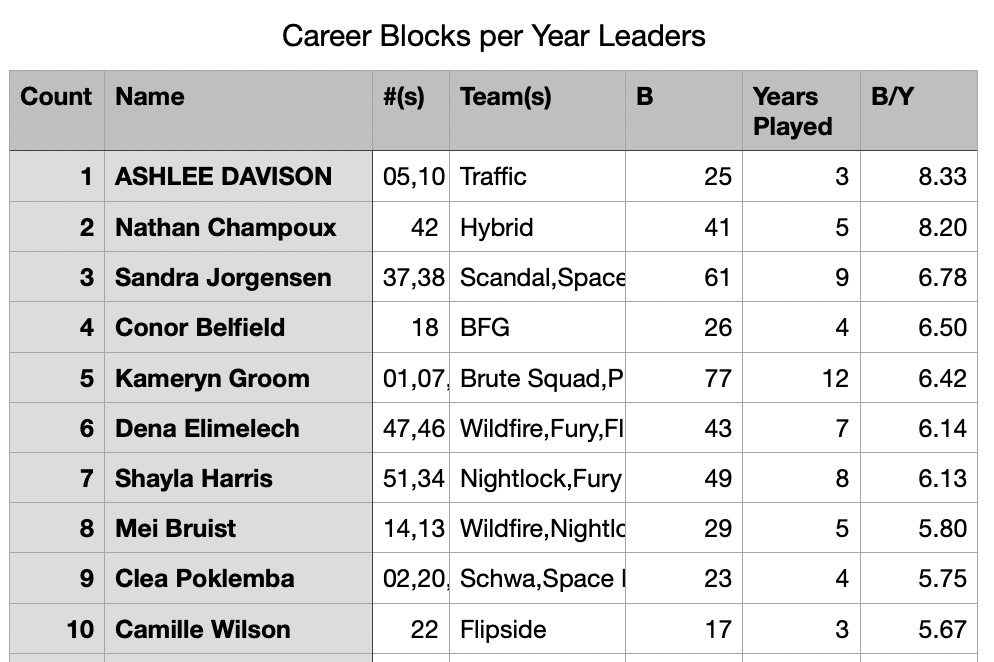
Kami Groom tops the career blocks list as well, again by a somewhat healthy margin. One of the biggest things I’ve learned during this project is just how impressive Kami Groom’s career has been. I knew she was really good, but I didn’t know she stood quite this far above the rest, stats-wise.
As we saw in the single-game stats, high block totals tends heavily towards woman-matching players—10 of the top 12 in career blocks have played in the Women’s division. Ryan Drost, at 10th, is the highest man-matching player on the list.
Nathan Champoux and Dena Elimelech stand out for high production in a lower number of total years. Elimelech is less than half a block per game behind Kami’s career rate (6.4 bpg vs 6.1 bpg).
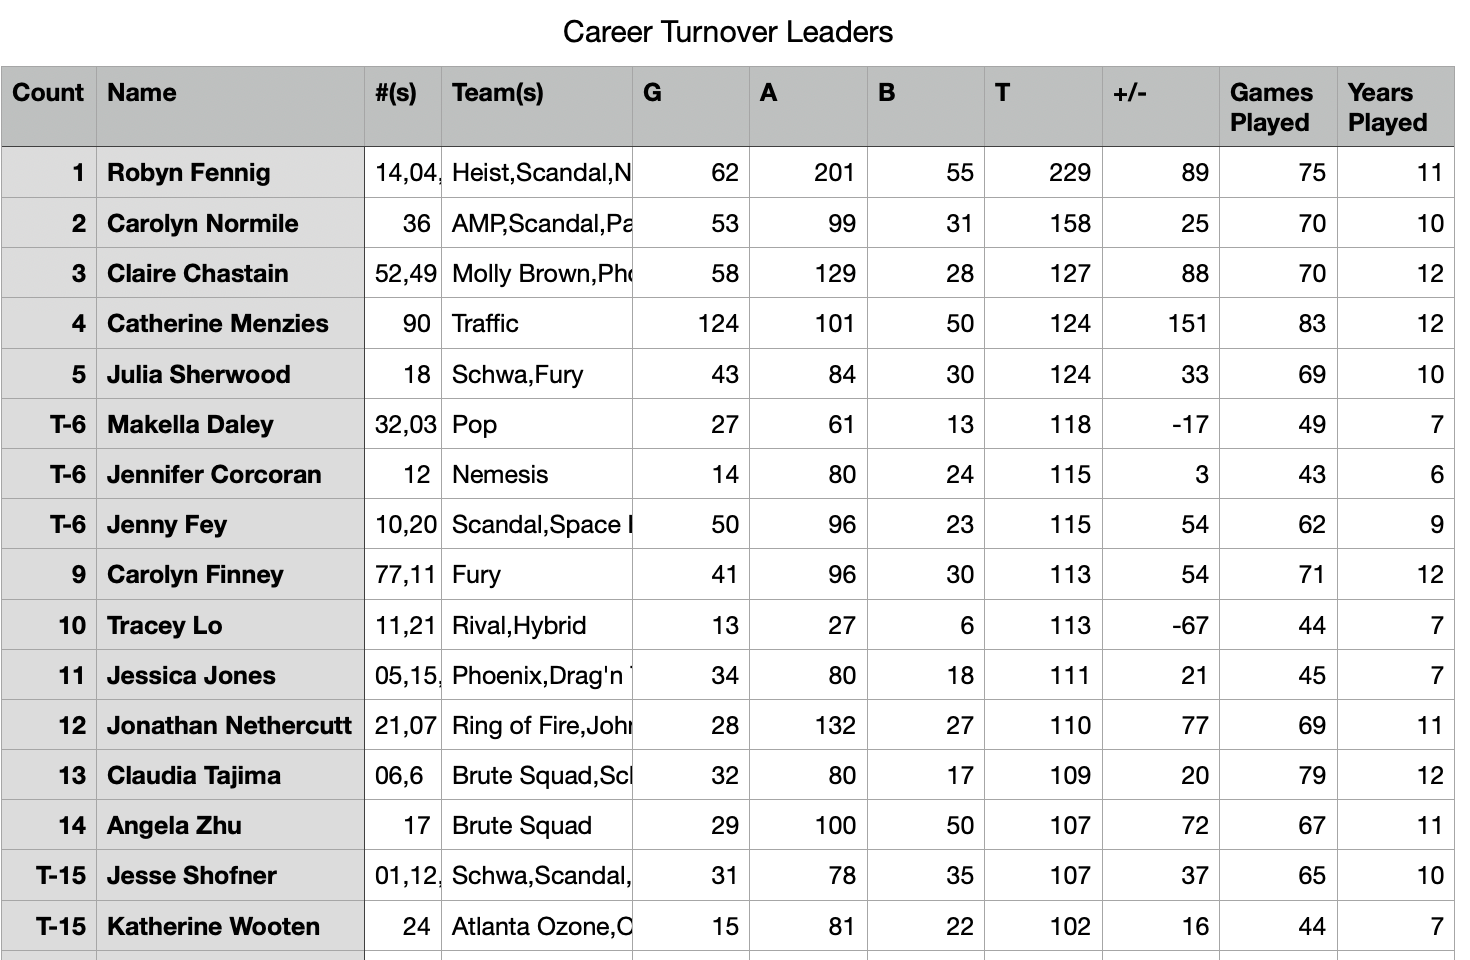
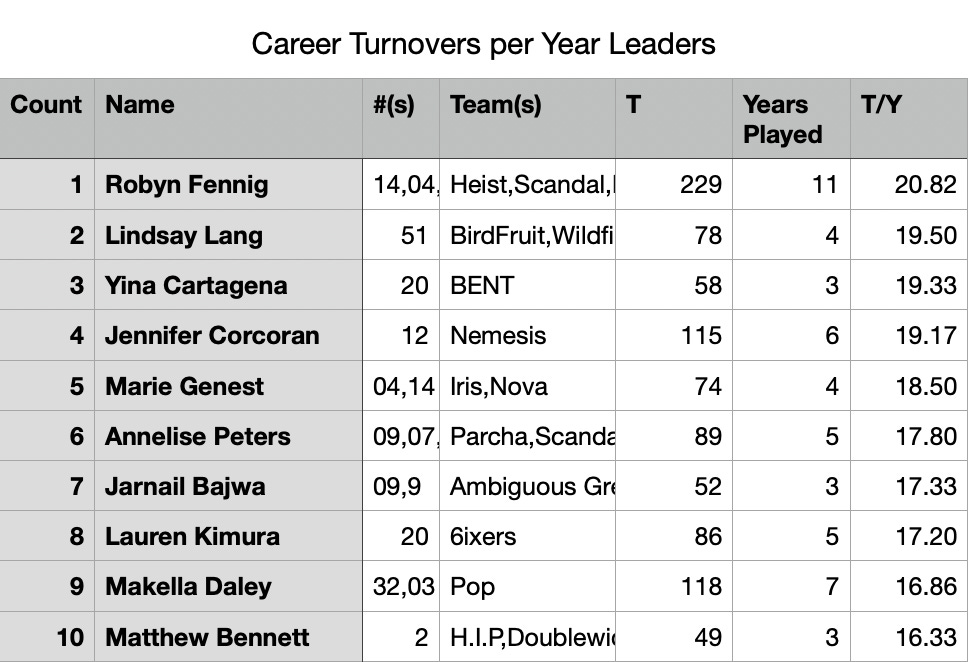
Robyn Fennig has more turnovers than any other player by far.
There are (unsurprisingly) a number of very good players on the career turnovers leader list. It’s your classic “you can’t lead the NFL in career interceptions without being a very impressive quarterback” effect. (Well, at least to some extent—here’s the NFL list)
Every player over 100 career turnovers is included in the current version of this table.
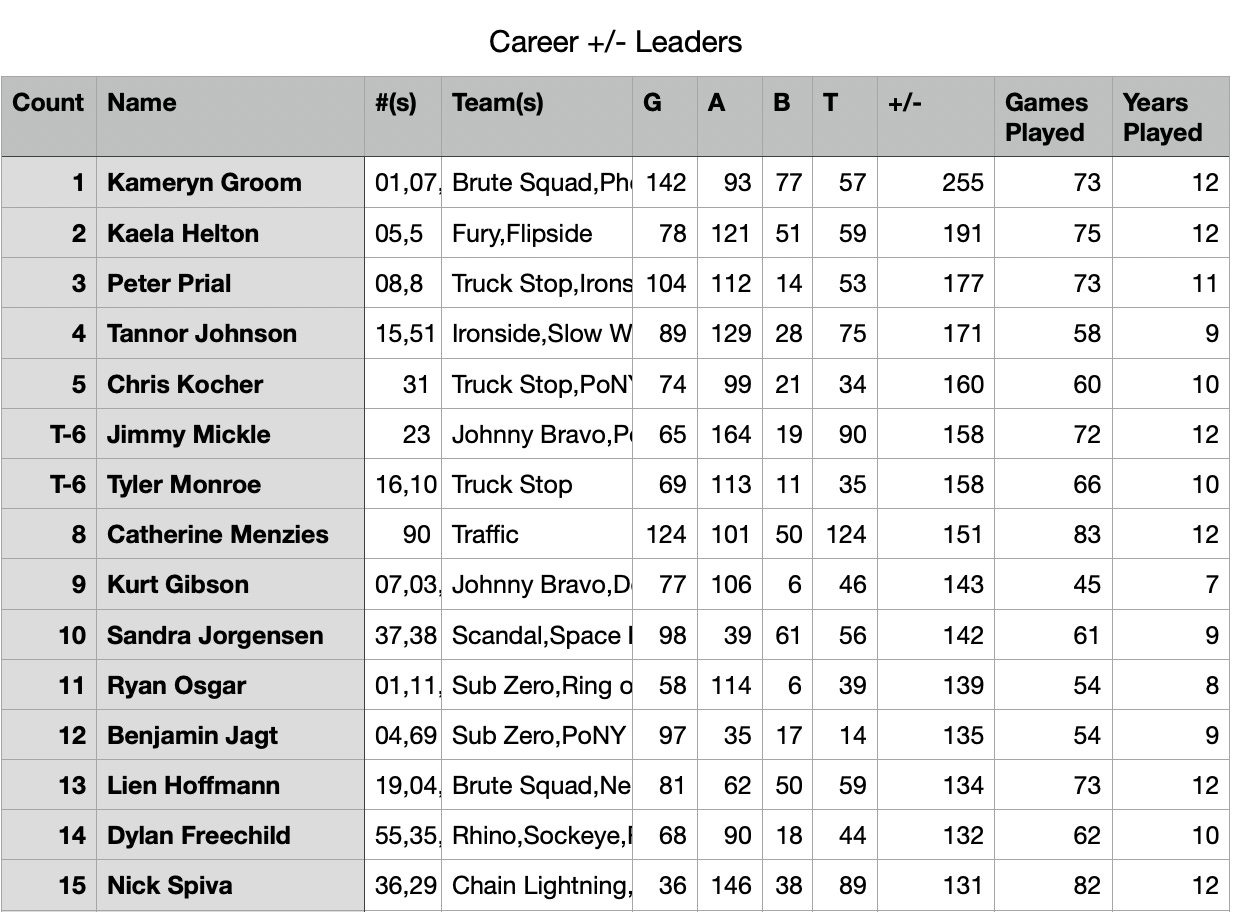
Unsurprisingly Kami Groom tops the career +/- list by a wide margin.
Kaela Helton shows up at #2, with a healthy gap separating her from #3. She’s 7th in assists, 5th in blocks and, at 17th, just outside the image I clipped for career goals.
Shout out to Kurt Gibson, all the way at up 9th on the list in only 7 years played. (Claire Trop & Dena Elimelech—tied at 27th—are the next closest players with 7 or less years played)
More than any other table in this post, I think the career +/- list is truly a “who’s who” of famous frisbee players. Even the next few players on the list after 15th follow the trend—Khalif El Salaam, Jack Williams, Rowan McDonnell, Matthew Redher, Josh Markette, etc.

Before we look at some more counting stats let’s give a quick shout out to the players who’ve been at every nationals in the database (2013 on):
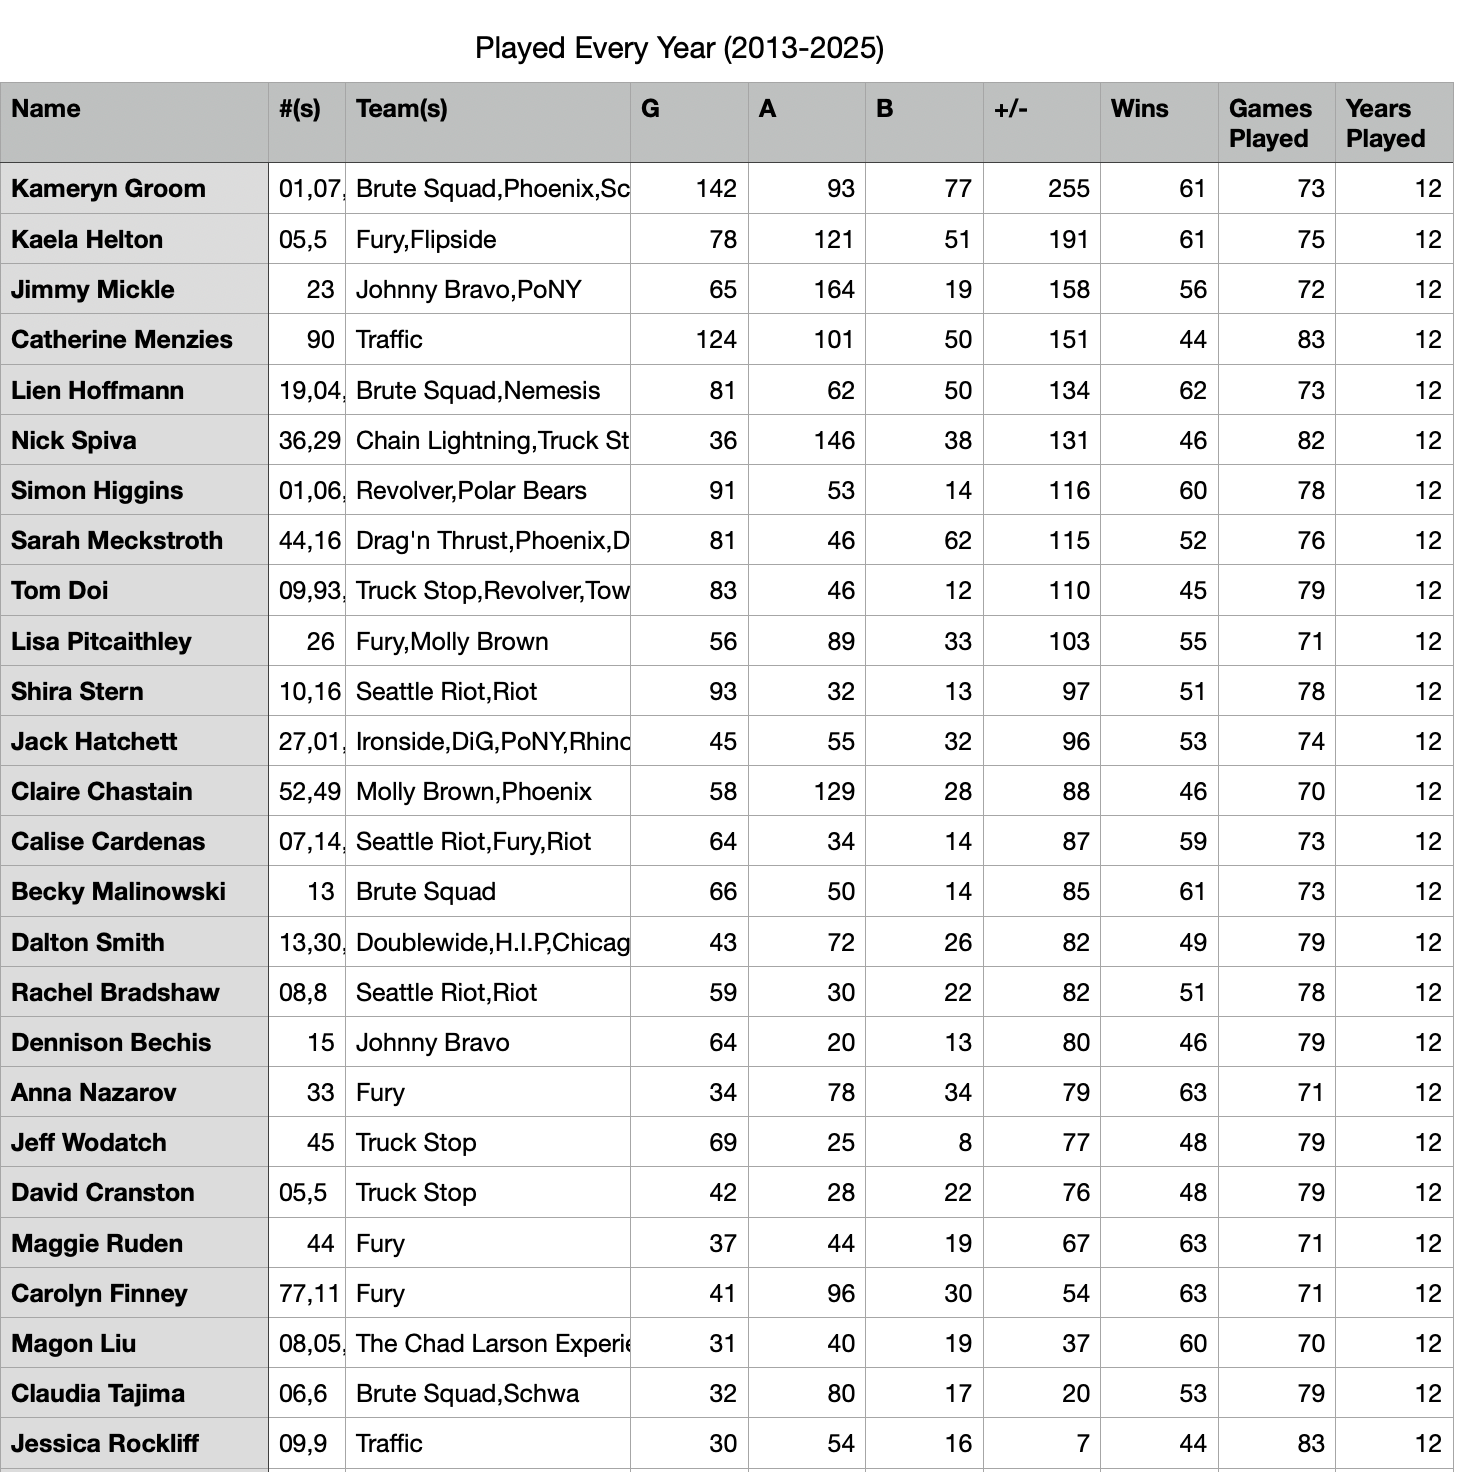
26 players have played at every Nationals from 2013-2025. Shoutout to Jeff Wodatch and his 8 blocks in 12 years, the only instance on this list of less than double-digit totals in any of goals/assists/blocks/turns.
A previous version of this image was missing Nick Spiva b/c his 2013 data had his name as “Nicky”, he’s now added to the list.
Another 25 players have played 11 years in the last 12.
Career wins/point diff/etc
With the data quality updates I made in April 2026, I now feel good enough about the win/point differential data to share some tables, although I expect there are still some small inaccuracies.
Unsurprisingly, the top of these lists is populated by players who have spent years on Fury and Brute Squad (though, to be clear, many of them have spent time on other teams as well).
Point differential:
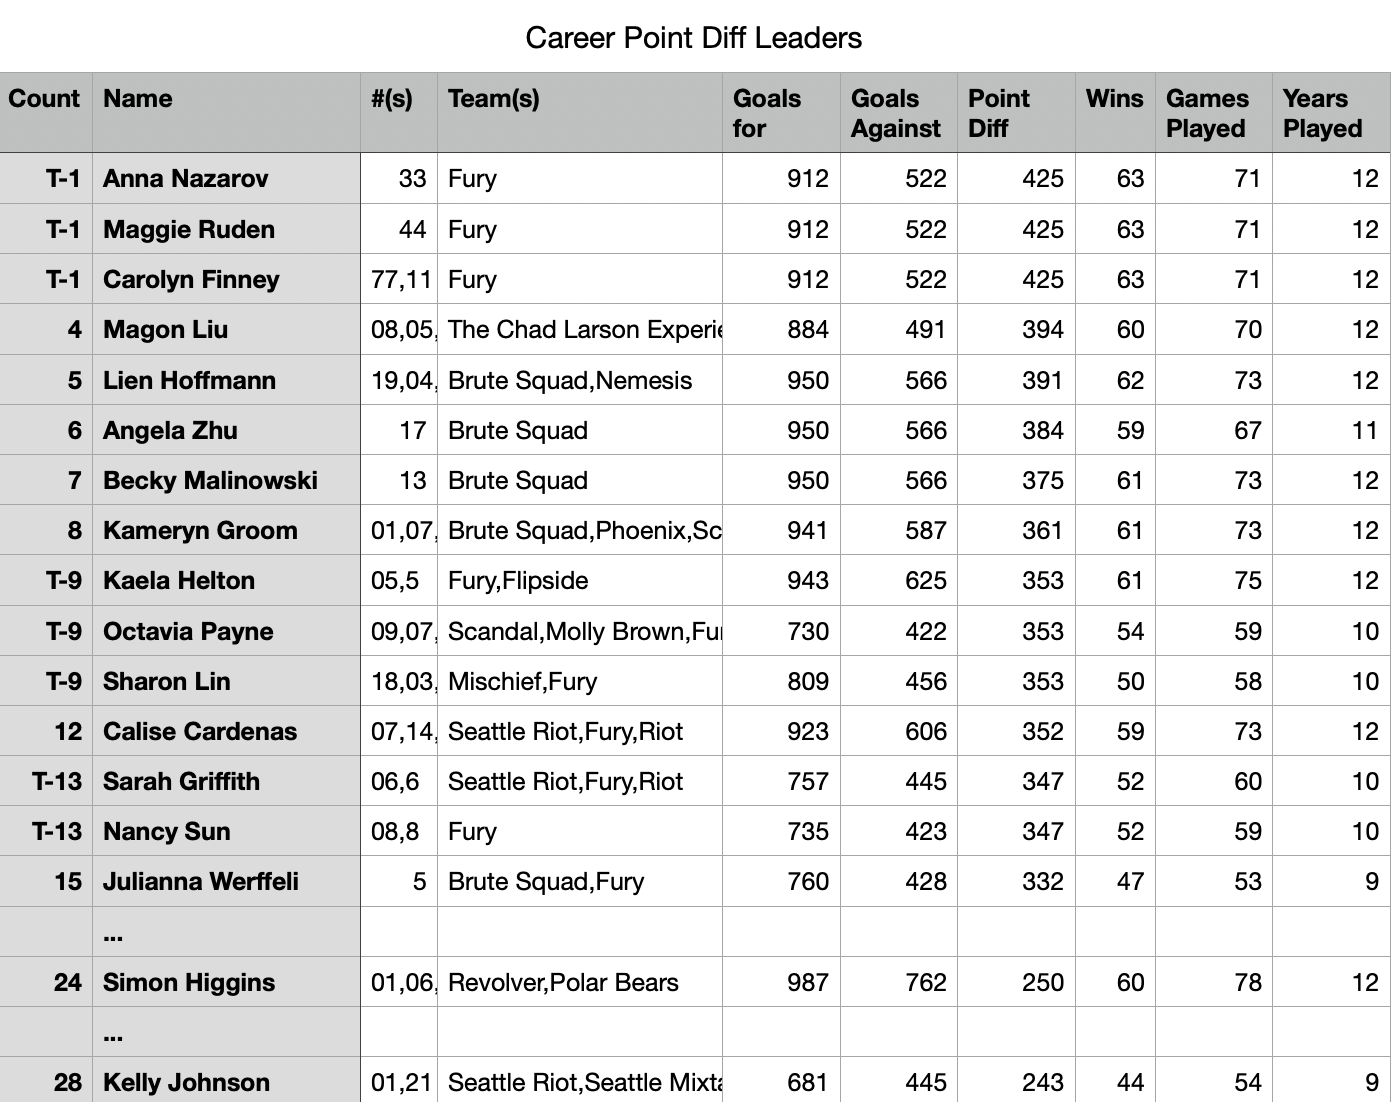
At the top are the 3 players who’ve been on Fury every year since 2013: Anna Nazarov, Carolyn Finney, and Maggie Ruden. Their career point differential is something like +425 (about +35 per year).
The highest ranking player I have that never played for Fury or Brute Squad—at 24th on the list—is Simon Higgins of Revolver (and Polar Bears) at +250. A few spots down at 30th is the next one—Kelly Johnson of Seattle Riot/Mixtape5 at +243.
Thomas Li and Alexa Kirkland (both of BFG & Polar Bears) are the highest ranking players I could find who had ONLY played mixed.
Wins
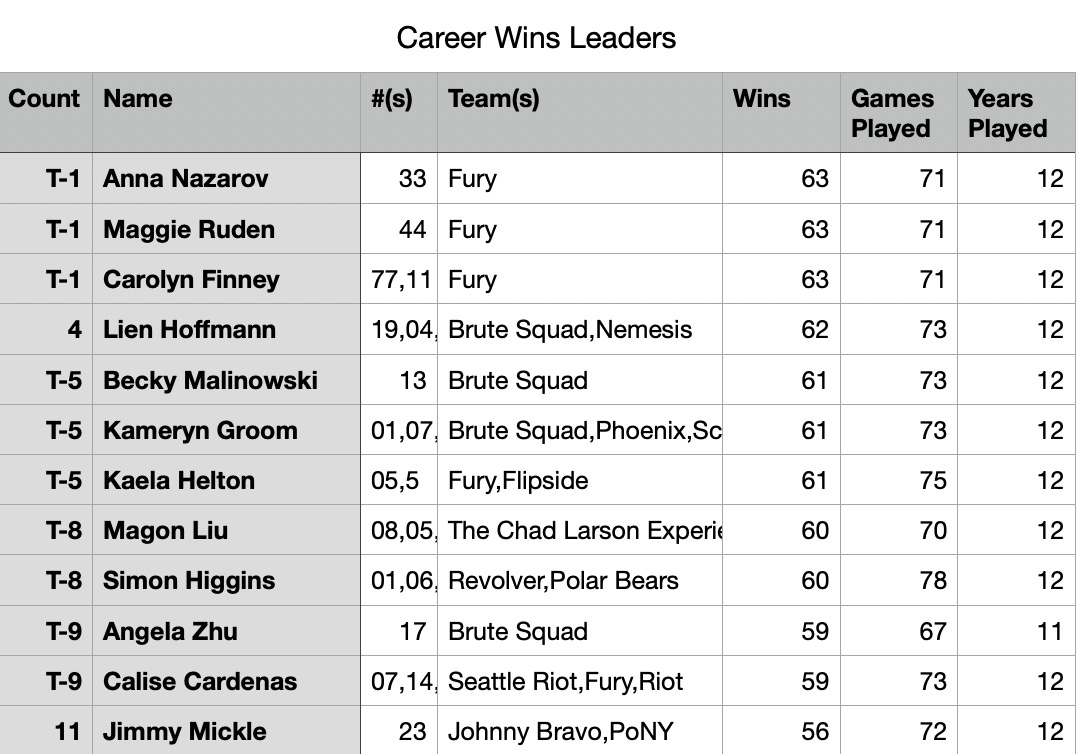
For wins, I see basically the same pattern, although with a bit less of a Fury/Brute Squad bias. The same 3 Fury players top the list at 63 wins.
Simon Higgins is at 8th with 60 wins, and we see a few more non-Fury non-Brute Squadders like Jimmy Mickle with 56 wins (11th) and Jack Hatchett at 53 wins (T-14th).
Win %
I filtered win percentage by players who’ve played a minimum of 3 years. That said, there are 5 players in the data who’ve played exactly 2 years of Nationals without ever losing a game—two from 2024/25 Hybrid (Maketa Mattimore and Calliope Cutchins), two from 2013/14 Scandal (Amy Hudson and Quinne Farenwald), plus Devon Anderson from 2013 & 2015 Revolver.
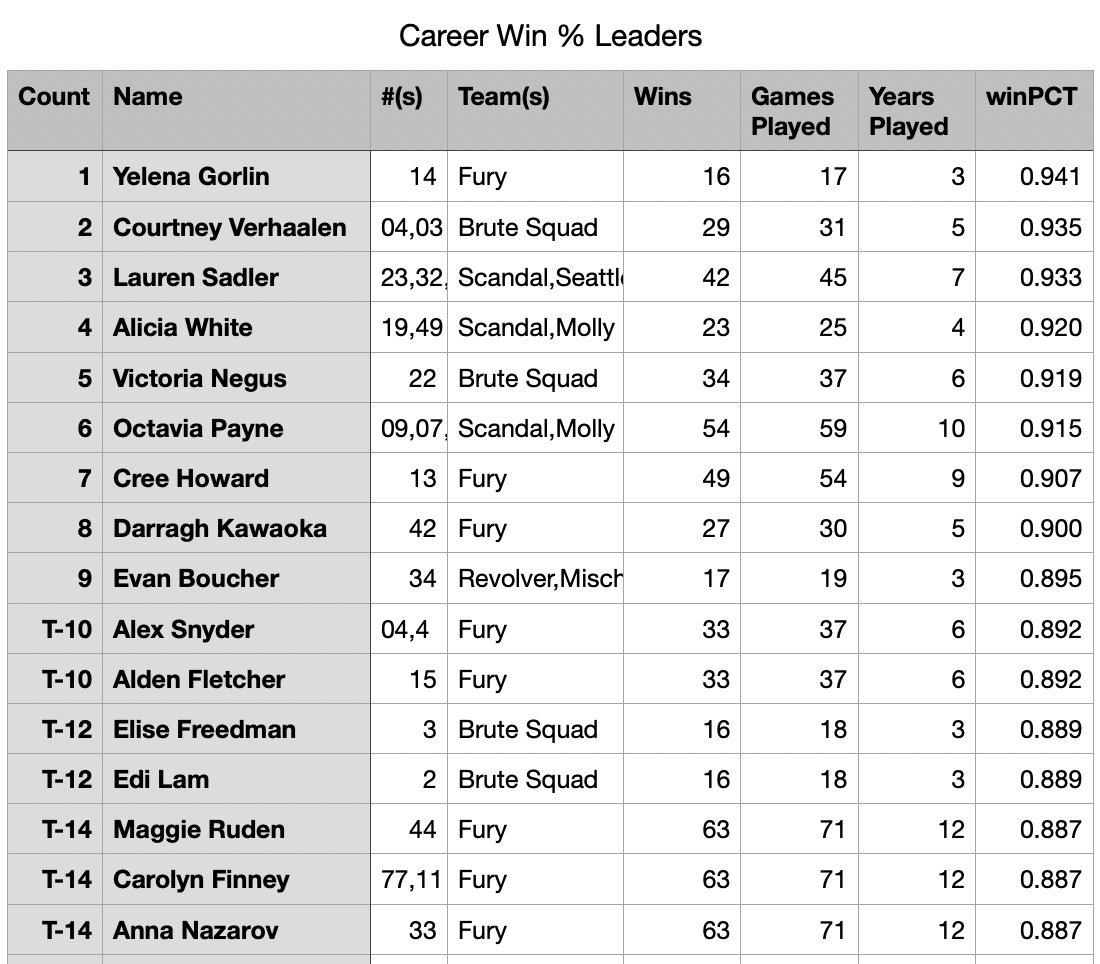
The general trends are the same, though without such a strong Fury/Brute Squad bias—Alicia White (Scandal, Molly Brown), Lauren Sadler (Scandal, Riot, Brute) and Opi Payne (Scandal, Fury, Molly Brown) are all in the top 5.
Evan Boucher (Revolver, Mischief), Aaron Bartlett (Truck Stop, Hybrid), and Ashlin Joye (Revolver) are the highest ranked players to have played in the Men’s division.
Career per-year averages
For all these stats I’ve used a minimum of 3 years played as it seemed like a reasonable cutoff of “actually has a Nationals career”.
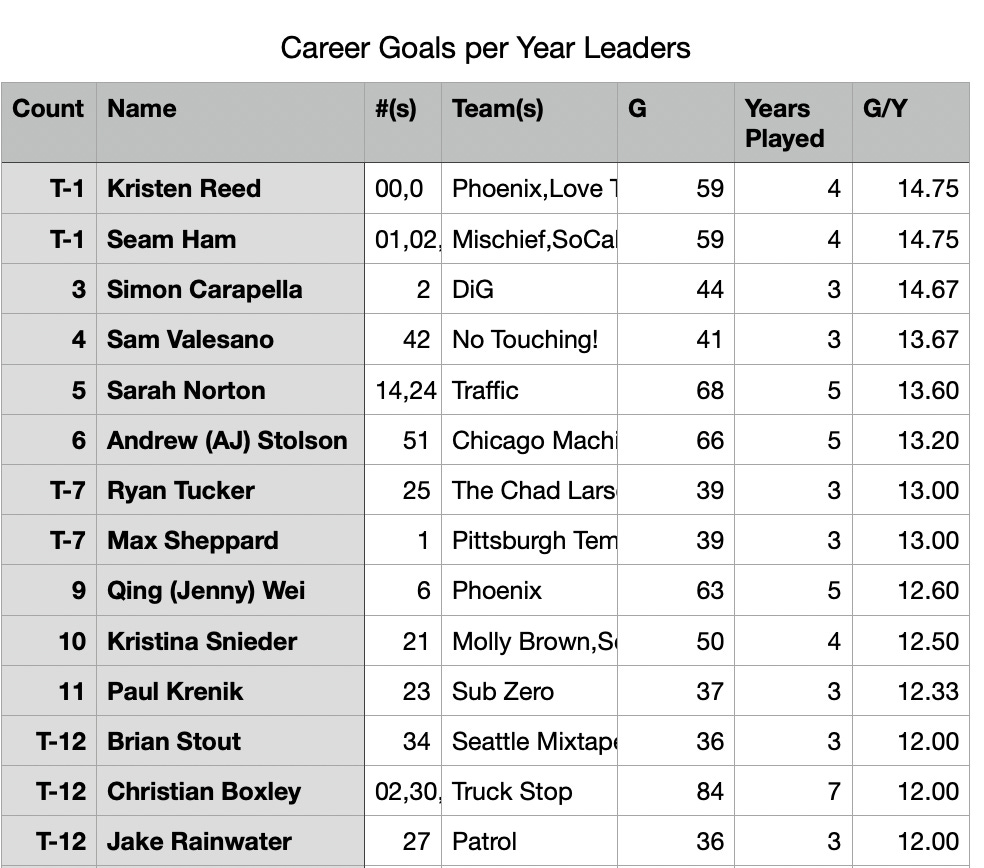
Two names we’ve seen before—Kristen Reed and Sean Ham—are tied atop the goals per year leaderboard, both with exactly 59 goals in 4 years.
Christian Boxley has played more years than anyone else above him on the list—maintaining elite production for 7 years and counting. The next name we can say that about is Kami Groom (20th on the list). Obviously once we get past Kami there’s no one else we’ll be able to say that about (Although Jade McLaughlin is barely 0.1 goals per year behind Kami’s pace). These players are basically the Pareto optimum for goal-scoring longevity—no one else has been that productive for that long.
I had no idea how productive Simon Carapella has been the past three years, I feel like his performance has been under the radar.
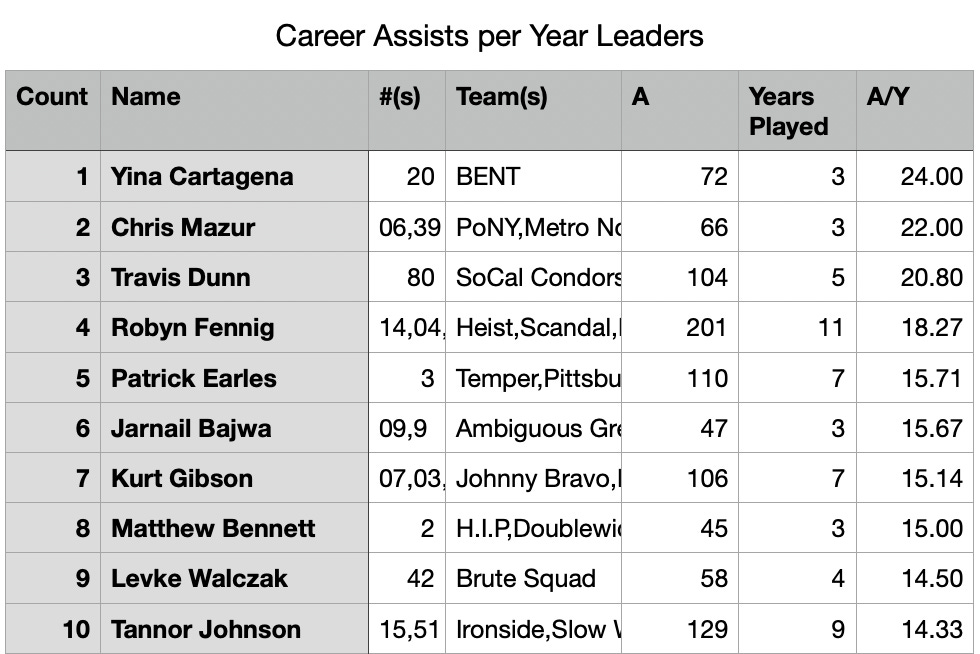
Yina Cartagena tops the career assist/year leaderboards. Given she didn’t start playing in the US until later in her career6 she’s unlikely to ever approach the top of the career total leaderboard, but her skills are undeniable.
Chris Mazur and Travis Dunn are the only other players above 20 assists per year. Travis is the only player with >20 assists/year and >3 years played (though Yina may reach that too). He put up 5 assists with Condors in 2019 but has never been below 22 in any year he attended Nationals since then.
Daan De Marree will likely join this list once he plays one more Nationals. Tayara Romero, Elliot Hawkins, and Tobias Brooks likewise have a chance to enter the list with more years played.
Career blocks per year looks pretty similar to the career total blocks leaderboard.
This chart really highlights Nathan Champoux’s current 5-year run (a full 1.5 blocks/year ahead of the next closest player!) and Kami Groom’s entire career (Sarah Meckstroth is the next closest player with 10+ years played).
Kami Groom and Sandy Jorgensen both moved up a few spots on this list compared to the original version I posted, now that more 2015 data is included.
Turnovers per year — don’t really see anything new to point out here, but included it for completeness
I believe this list shares 4 players (Fennig, Cartagena, Bajwa, Bennett) with the career assists per year leaderboard.
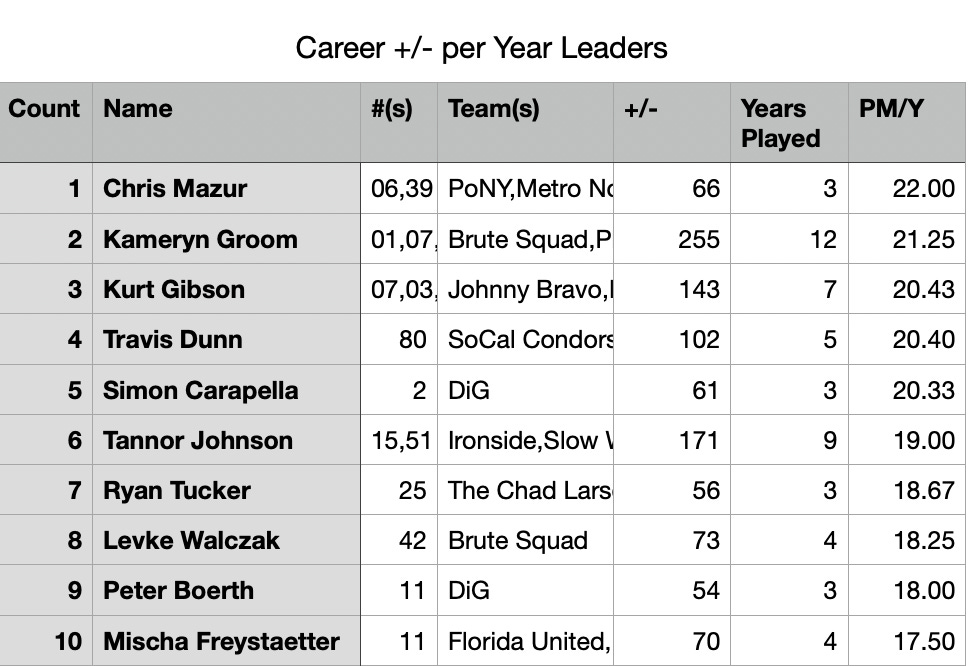
+/- skews pretty heavily towards male-matching players, with only Kami Groom and Levke Walczak in the top 10 on the woman-matching side.
Again, I didn’t realize how much Simon Carapella has filled up the stat-sheet in the past 3 years. Peter Boerth, also of DiG, has also been filling up the stat sheet. Those two DiG players have a combined average of only 2 turnovers per year (1.33 for Simon, 0.67 for Peter).
Other players on this list, like Travis Dunn, Levke, and Tannor Johnson, rack up more positive stats but also many more turnovers.
Career stats — various
Here’s a few more stats I calculated for fun, using goal/assist/turnover ratios to highlight some of the more obvious player “prototypes” (again with 3 year minimum):
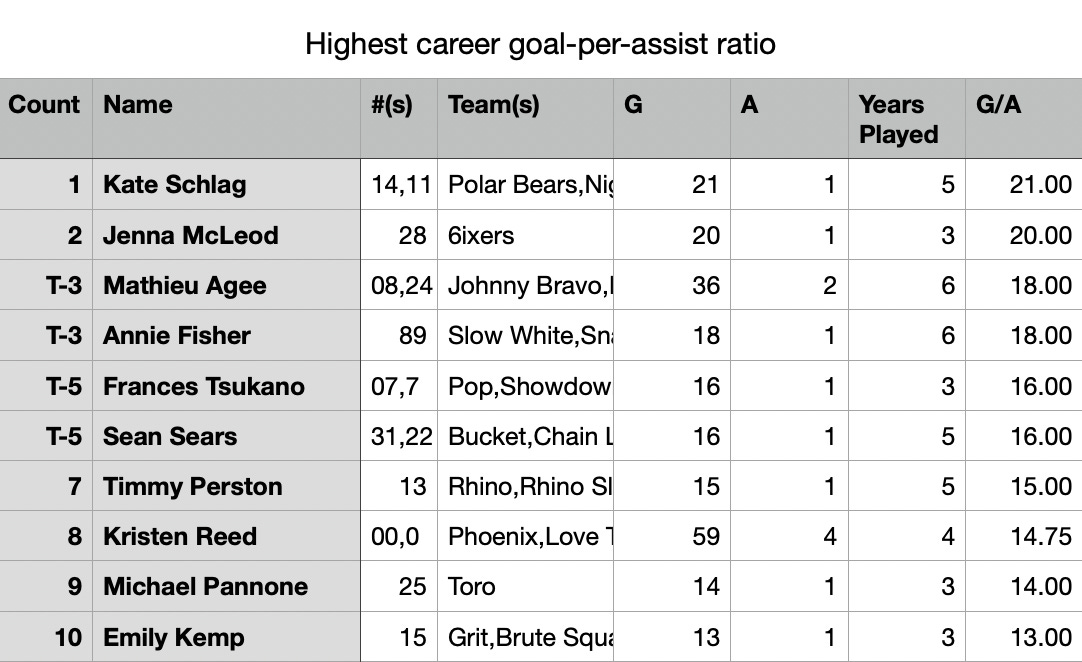
Above is the players with the highest goal-per-assist ratio. You could call them “bucket getters”. There are a few other players who might be on this list but they never threw a single assist (and I can’t exactly calculate a ratio if the denominator is zero). Three players in Nationals history have 20+ goals and no assists.
Not shown: the first player on this list with >5 assists is Jeff Babbitt (35th place), with 56 goals and 7 assists (8.0 ratio). The next player after that with >5 assists is Ella Juengst (74th place), with 79 goals and 13 assists (6.1 ratio). Let’s say those two plus Kristen Reed are the standard for high output bucket-getting.
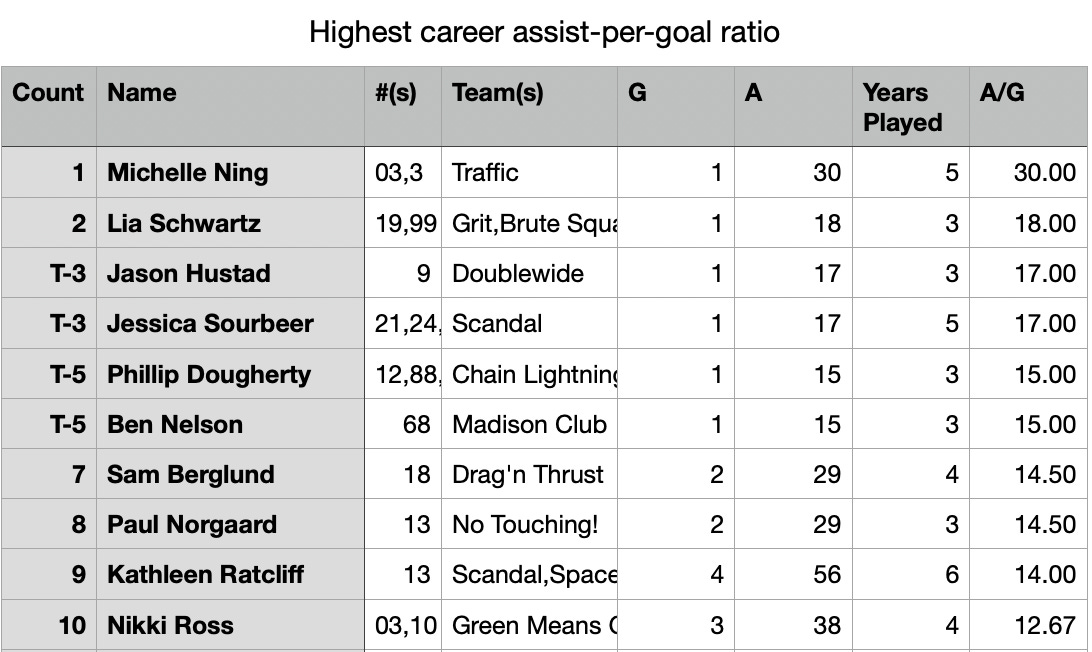
Above are the leaders in “assist per goal” (minimum 1 goal). I’m not sure what to call this group— “pocket passers” maybe? Lia Schwartz is a young star who I wouldn’t be surprised to see fall off this list as she gets older.
Shoutout to Matt West of 2013-2017 Mischief, who put up 34 assists without ever scoring a goal. I believe no one else with 0 goals in their Nationals career has more than 18 assists.
Not shown: some top players on this list with a high assist output: Yina Cartagena with 72 assists and 7 goals (10.3 ratio). Further down, Simon Montague ( 133 / 25 = 5.3 ratio) and Nick Spiva ( 136 / 27 = 5.0 ratio) are the first players on the list >100 assists.
Shoutout to Jana Krutsinger, the only player with women’s division experience on the list.
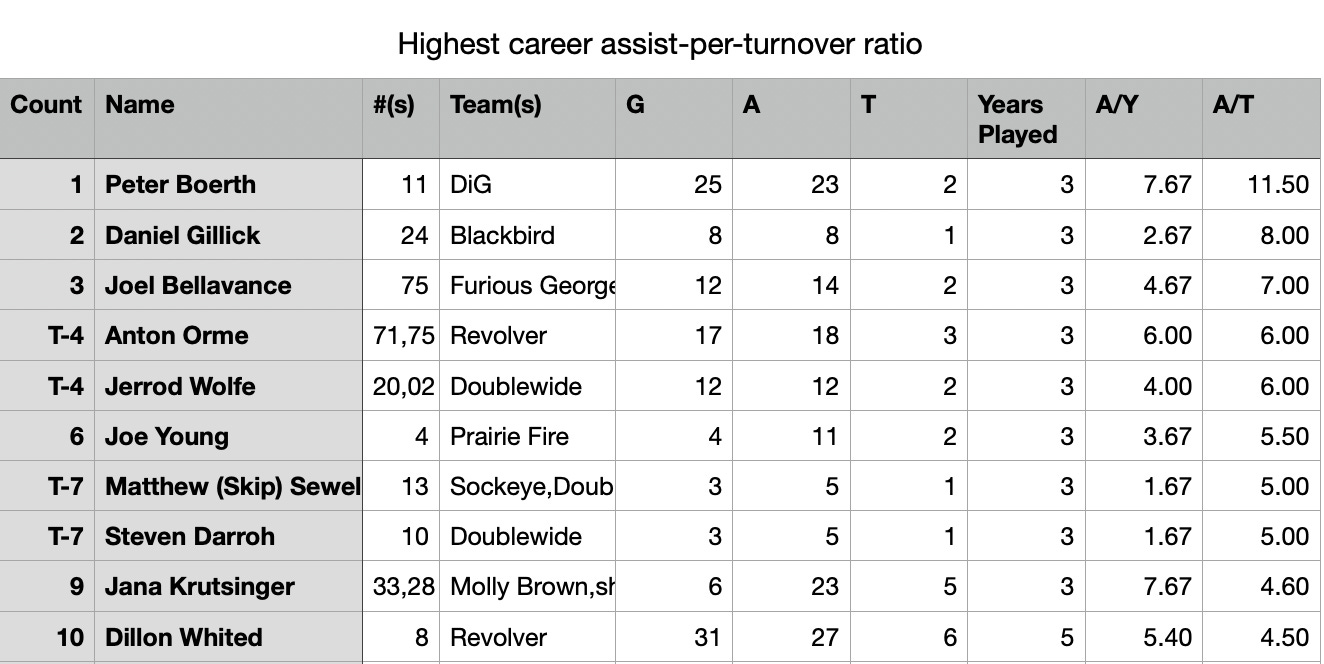
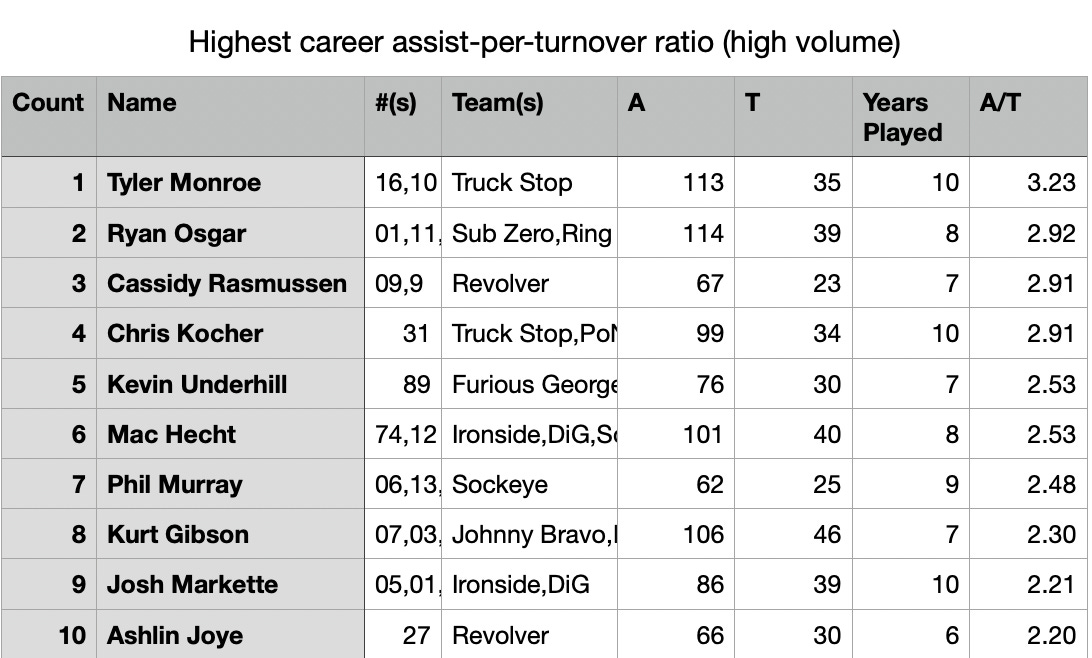
Assists per turnover —it’s clearly very hard to get on this list while also playing more than the minimum 3 years (shoutout to Dillon Whited for being the only one!). Because of that, I went through the list manually and picked out the first few players who also had more than, like, 60 assists. That list is:
Since that list is all man-matching players, I went back and generated a table of the highest A/T ratio among the top 25 or so career assist leaders for woman-matching players:
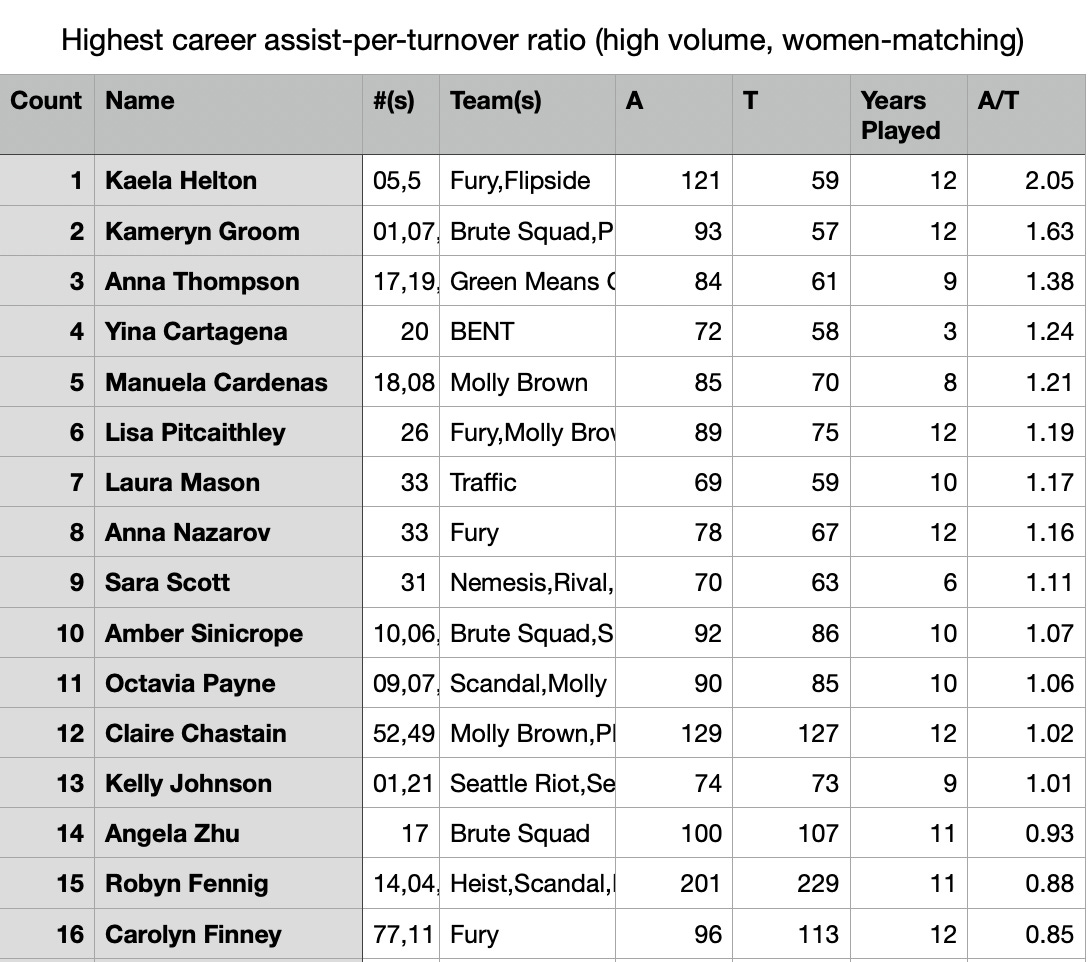
Analysis: my estimation of Kaela Helton just went up again.
That’s basically all I’ve got for you…read on if you really want to know all the issues and technical details:
General notes on data and code
This data is absolutely not perfect. But...it’s the best we have, and I think it’s at least good enough to be worth putting together this project.
There are a number of known issues (see below). Newer years have better data than older years. Some but not all of those issues can be fixed by USAU fixing broken links on a few tournament schedule pages.
Basically, you should image every table and every sentence having an asterisk at the end of it—*at least, as far as our imperfect data says. Having mentioned that here, I’ve tried not to talk too much about data quality in the rest of the post. There’s a detailed list of known issues below.
Also: full disclosure, I used AI to write the code that scrapes the data from USAU. In short, my feelings on AI are: I don’t hate AI as much as some people on the internet do. I hate it as much as everyone else does when AI is used as an excuse to not think for yourself. But I think AI’s pretty cool when we use it to do more than we would’ve been able to do otherwise. And while I know some coding, I definitely don’t have the coding skills to have done this on my own.
I’ve taken the time to double-check the data and I pretty strongly believe there is no “hallucinated” data. I double-checked a lot of individual games/years in the process of writing up the text portion of this article and never found a single issue. This isn’t really the type of situation where AI is liable to hallucinate anyway. The issues with the data collection described below are issues of how I defined the program to work, not issues caused by the AI tool I used to generate the code.
I’m happy to share my code7 with anyone who’s interested, but I have to warn you, while I know enough about coding to finish this project, I’m not exactly an expert at either coding or database management and someone who knows what they’re doing would probably find my solutions ‘ugly’.
Known errors / Potential improvements / Other notes
[Update (2026-04-22)]: Some of these notes below are now out of date, see Update on Career Nationals Stats for more info. I haven’t necessarily updated all the relevant bullet points below.
Partial data from the 2011 tournament is available here. I chose not to include it because:
It doesn’t include blocks or turnovers. And,
The way the data is presented would have meant I needed to spend a lot of extra time ripping it.
The USAU archive’s page for 2012 has a note that says: “Individual statistics (not yet available)”. I’ve emailed USAU to try to find out if this data exists on a hard drive somewhere.
The ulti.info link with 2013 results (here) is clearly not error-free. I noticed at least 1 game that has different scores posted depending on which team’s results are being viewed. So far I haven’t been able to find the firsthand source for these tournament results (the results links here are broken).
Some games have broken links that mess with my script’s ability to download them. For example, go to the 2014 Mixed tournament here then click on the “Placement Bracket (Elite Flight)” tab and click on the link that loads the game report for the game between Polar Bears and 7 Figures. It’ll take you to this blank game report, so although the box score actually exists if you access it through each team’s results page, it’s not currently included in the data. The 2015 semis game between Brute Squad and Molly Brown is another example. Based on a quick check, these broken links seem to go as late as 2017 but not after that.
My script calculates the final score (and thus the winner of the game & point differential) by adding up the number of goals in each box score. However, some games as late as 2015 if not later (here’s an example) don’t have the same number of goals in the box score as the final score. This means point differentials and possibly win/loss records aren’t as accurate as they could be.
There are other games (this one for example) that simply don’t have box score stats recorded. There are examples of this as late as 2019.
Name related issues:
Name changes: Because all of the data is downloaded at one time, I believe most potential issues for names that changed (due to marriage, nickname use, etc) are avoided. As long as the player is still using the same USAU account, their name is now shown as their current name on the roster, even for old tournaments. I have not tried too hard to see if there are any issues of this sort.
Name changes, 2013 edition: Because the 2013 data was acquired differently, specifically for the year 2013 there is the potential for names not matching up. I haven’t tried too hard to fix these issues, however I did manually change a few names that came up in the natural course of the project, as below:
Robyn Wiseman -> Robyn Fennig
Kaela Jorgenson -> Kaela Helton
Catherine Hui -> Catherine Menzies
Jessi Jones -> Jessica Jones
Kami Groom -> Kameryn Groom
Sandy Jorgensen -> Sandra Jorgensen
Nicky Spiva -> Nick Spiva (added 2026-04-23)
Georgia Bosscher->Georgia Shriwise (added 2026-04-23)
Duplicated names: There is a potential for duplicated names (multiple people with the same name). If people had duplicate names in the same year, this is easy to see in the data, because they’ll have an impossible number of games played. I believe there are only 3 examples of this: 2016 Jordan Taylor (Ironside and DiG), 2017 Jordan Taylor (Ironside and Mischief), and 2019 Rachel Johnson (Pop and Superlame). I haven’t bothered to separate these into different players b/c none of them had enough stats to influence any of the images included in this article.
Duplicated names, part 2: If two people had the same name but played at Nationals in different years, that’s a bit more challenging to detect, so there may be some instances of that which I haven’t caught. I don’t believe there’s any examples of this in any of the images in this article, however.
“Unknown”—some stats in the 2013 stat sheet are assigned to “unknown”. I just left them in the data as-is, since it didn’t end up inconveniencing me in any way.
Potential improvement: Ultiworld has detailed stats (yardage, points played, etc) for the championship games that I could theoretically integrate with this data. However since it’s only for the championship game, it’s so limited at this point that it’s not really ever going to tell us anything besides who made finals.
Potential improvement: I originally wanted to track whether games happened in pool play, championship bracket, or consolation. However, that’s not consistently shown on the results page. For example this quarters game from 2014 has “Quarterfinals” in the match report header, while this quarters game from 2017 does not. I’ve emailed USAU to ask if they’d be willing to go back and add this data in a consistent manner. I could theoretically re-write my scripts to get this information from the tournament schedule page, but that would require a lot of work and I’m not confident I have the coding skills to do it that way.
See known issues section, not every game’s data is currently included
Obviously there were great players before this time too. And even some players who do show up on the lists below have their stats look less impressive because it doesn’t include data from before 2013. Grant Lindsley, for example, has played at basically every Nationals from 2006 on.
That’s not a typo in the chart, at least not by me—his name really is currently displayed as “Seam” Ham on USAU.
And yes, if you opened that link you’ll find that both of these two Nationals were before she started playing college frisbee.
and Nemesis in 2013? Or is that a different Kelly Johnson?
She was on BENT in 2021 (but she wasn’t on their Nationals roster) and in 2022 (but BENT didn’t make Nationals). But she was playing for Colombia on an international level as early as 2012 per Ultimate Reference.
Both the code AI wrote to scrape the data and the separate code I wrote to collate the data into 3 spreadsheets
I think the next step is to generate some "who was the best at X" controversies, then make some video compilations of people who the data show were at the absolute top of the game... maybe some unsung heroes...
Insanely good post. Reminds me of the types of analysis we used to do on skyd, although I'd say yours is even much more comprehensive than we did!