Recently I've been looking into doing some UFA data analysis, and, as a result, I did some background research to find out what's already out there. I found a good amount of content I'd never seen before (and I spend a lot of time on the frisbee internet!) so I thought I'd put together a summary of existing UFA data science projects.
If you're looking into doing UFA data analysis yourself, I hope this saves you some time in getting up to speed. Or if you merely like reading interesting frisbee analysis, I hope you can find some of what you're looking for in the links below.
As always, please let me know if you're aware of anything that should be on this page but isn't listed. Without further ado:
Analysis by Comet
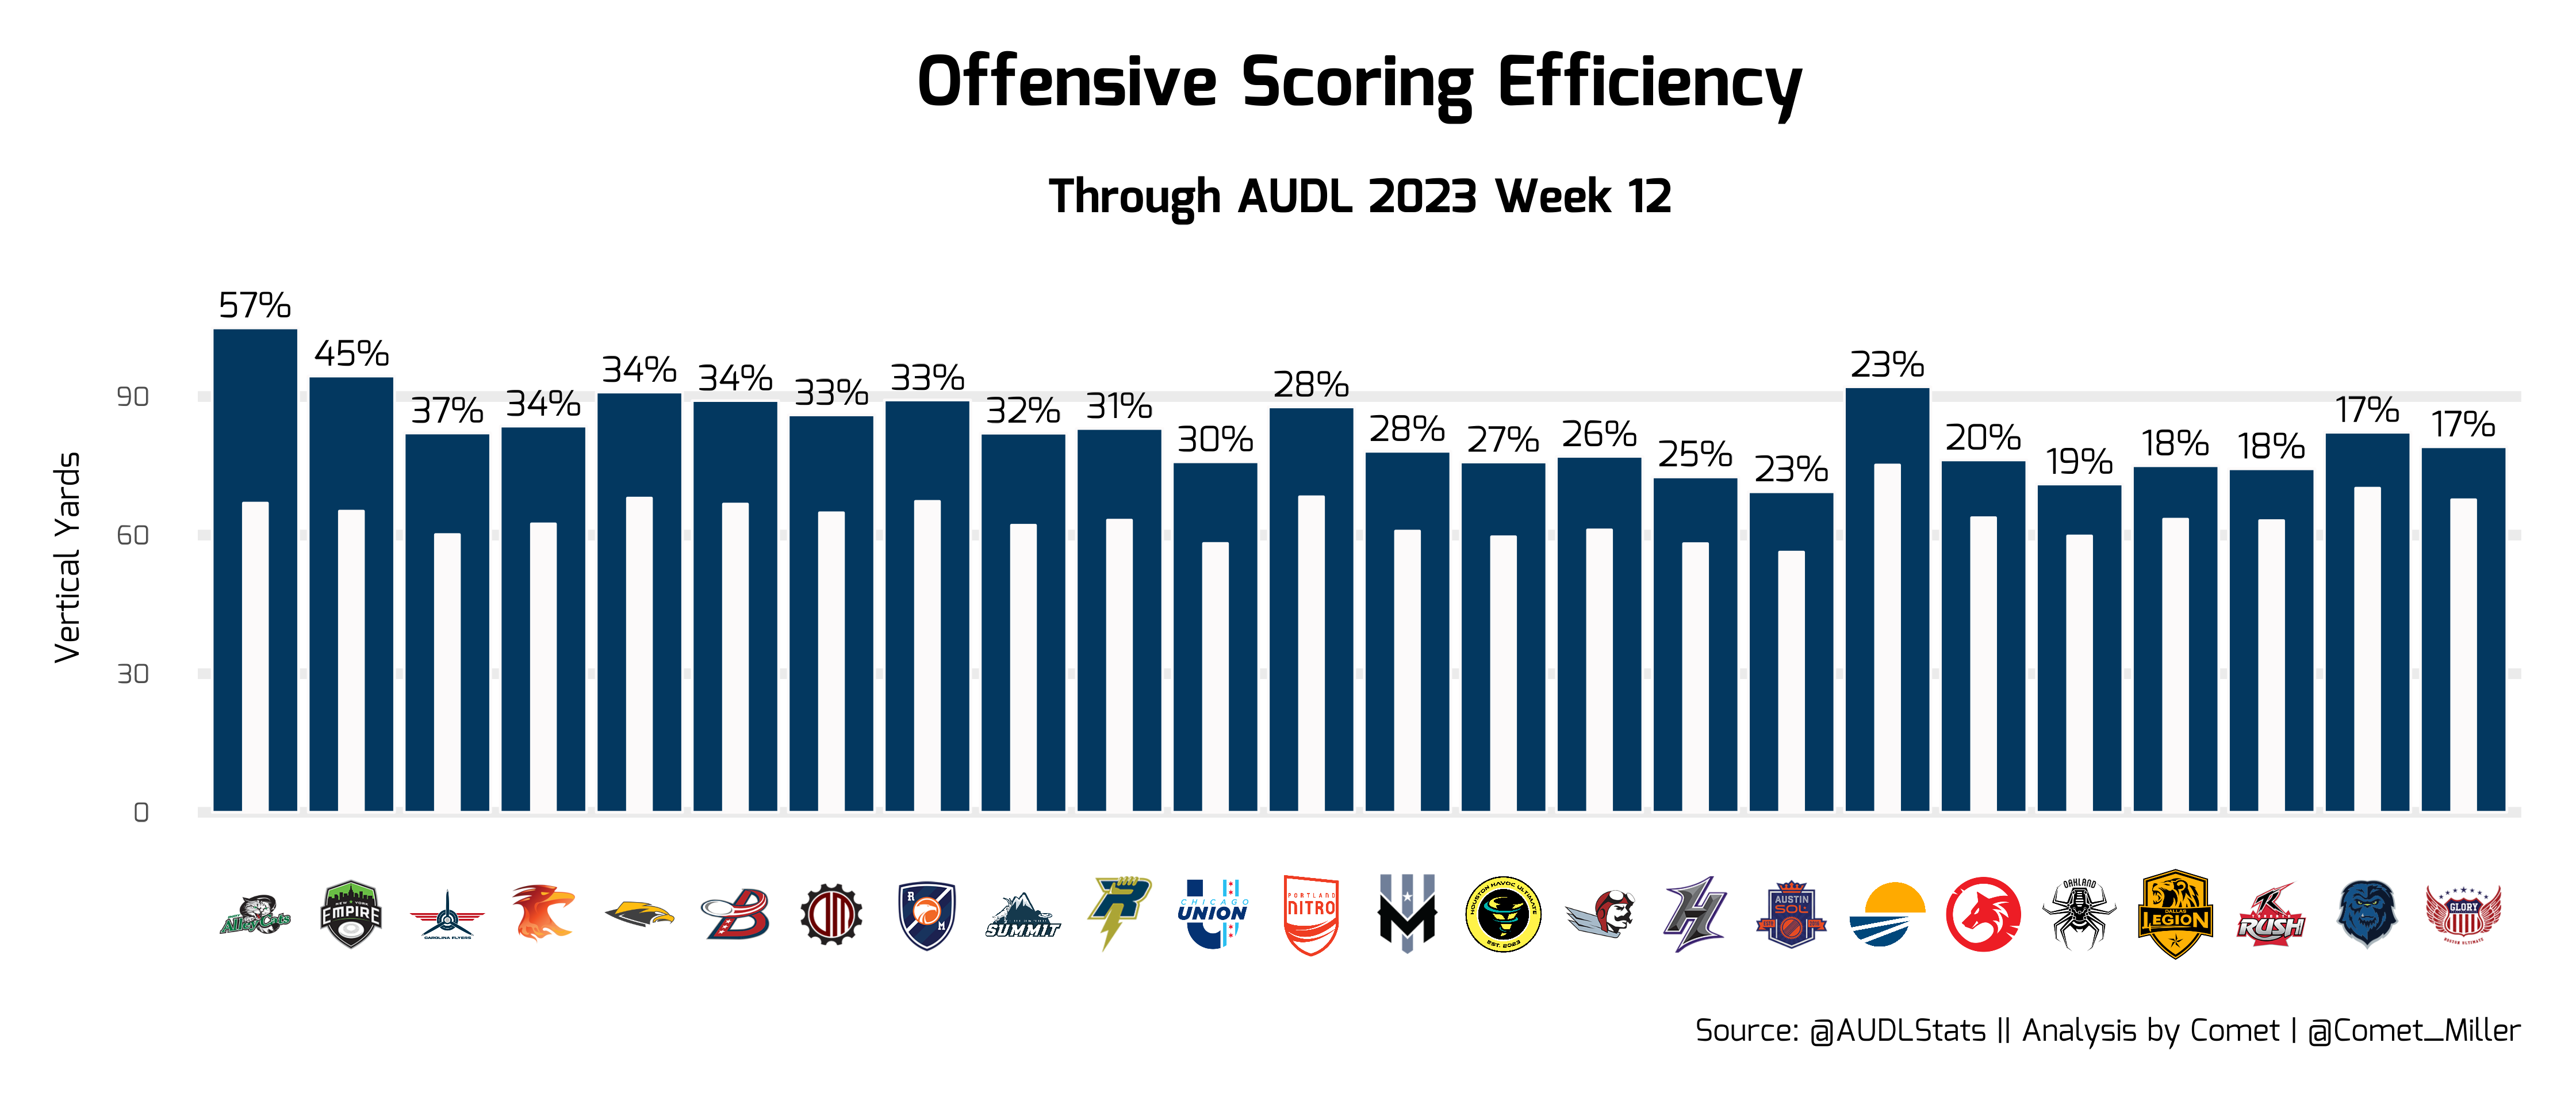
A very cool blog that made 8 posts in mid-2023 and hasn't posted again since (but posted on Twitter through spring 2024). All their charts are very professional (I'm jealous, to be honest, I need to step up my game) and the ideas are quite interesting. I like this post analyzing the amount teams go backwards (or force their opponents to go backwards) in order to score.

I also like this post highlighting how Championship Weekend teams often played lines that weren't actually playing together during the season. I knew lineup consistency was an issue in the league, but I didn't know it was this bad.

Colin Scott
An author named Colin Scott published 4 posts on Medium in late 2023. They are:
The Worst Passes in Ultimate — Modelling Completion Likelihood
Measuring Player Efficiency in Ultimate — Expected Points Contributed
Perhaps of note for data modelers:
At this point, I must give thanks to David Sumpter, whose Soccermatics course on football analytics provided the perfect base for my code; I hugely recommend taking a look if you are interested. My model was largely a copy-paste job from this page of the course.
In Scott's "xG Model" paper, he creates a heatmap of average performance and compares that to actual player performance to determine which players produced more actual assists than expected Assists (xA). In other words, which players' throwing skills led them to cash in on more goals than expected given the location they were in on the field (Austin Taylor was somewhat of an outlier, throwing many more assists than expected. Pawel Janas had a lot of assists, but didn’t have more assists than expected based on where he was getting the disc—but that doesn’t necessarily account for the fact the getting the disc in good places to throw assists is itself an important skill):

I'm not as impressed by the "worst passes in ultimate" post, which mostly just seems to be telling us that it's bad to throw hucks that end up out of bounds (but the real value of this post builds up towards his later work):

"Measuring player efficiency..." is probably his best and most thorough post. I'm curious what we can learn from watching the pullers that his model thinks are the league's best. The model also suggests that the best offensive players provide 30 "points contributed" over the course of the season, while the best defensive players are only at 10 points contributed (on defense, that is). That seems roughly in line with the way ultimate people think about the relative value of each.
Although he never really discusses it further in the article, I was intrigued by this image showing how all the examples of the best multi-pass sequences that increased a teams “expected point result” involved big yardage gaining cross-field passes (below, left half):

Maybe swinging the disc is still underrated? (Or the more boring interpretation: good break throws are good.)
Dan Fiorino
Instagram (I don't have Instagram so I can't verify I've actually got this link correct...)
Dan authored two Ultiworld articles, in 2017 and 2019, as well as publishing some analysis on Twitter.
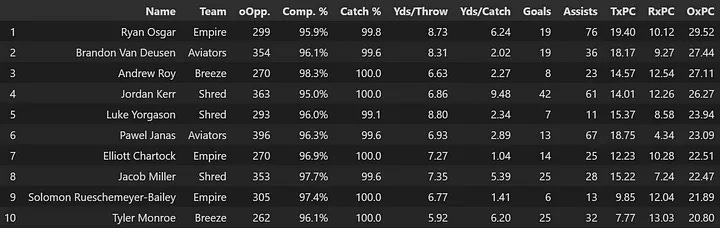
I especially liked a couple of tweets showing players whose defensive (or offensive) efficiency was much higher than their team's average:
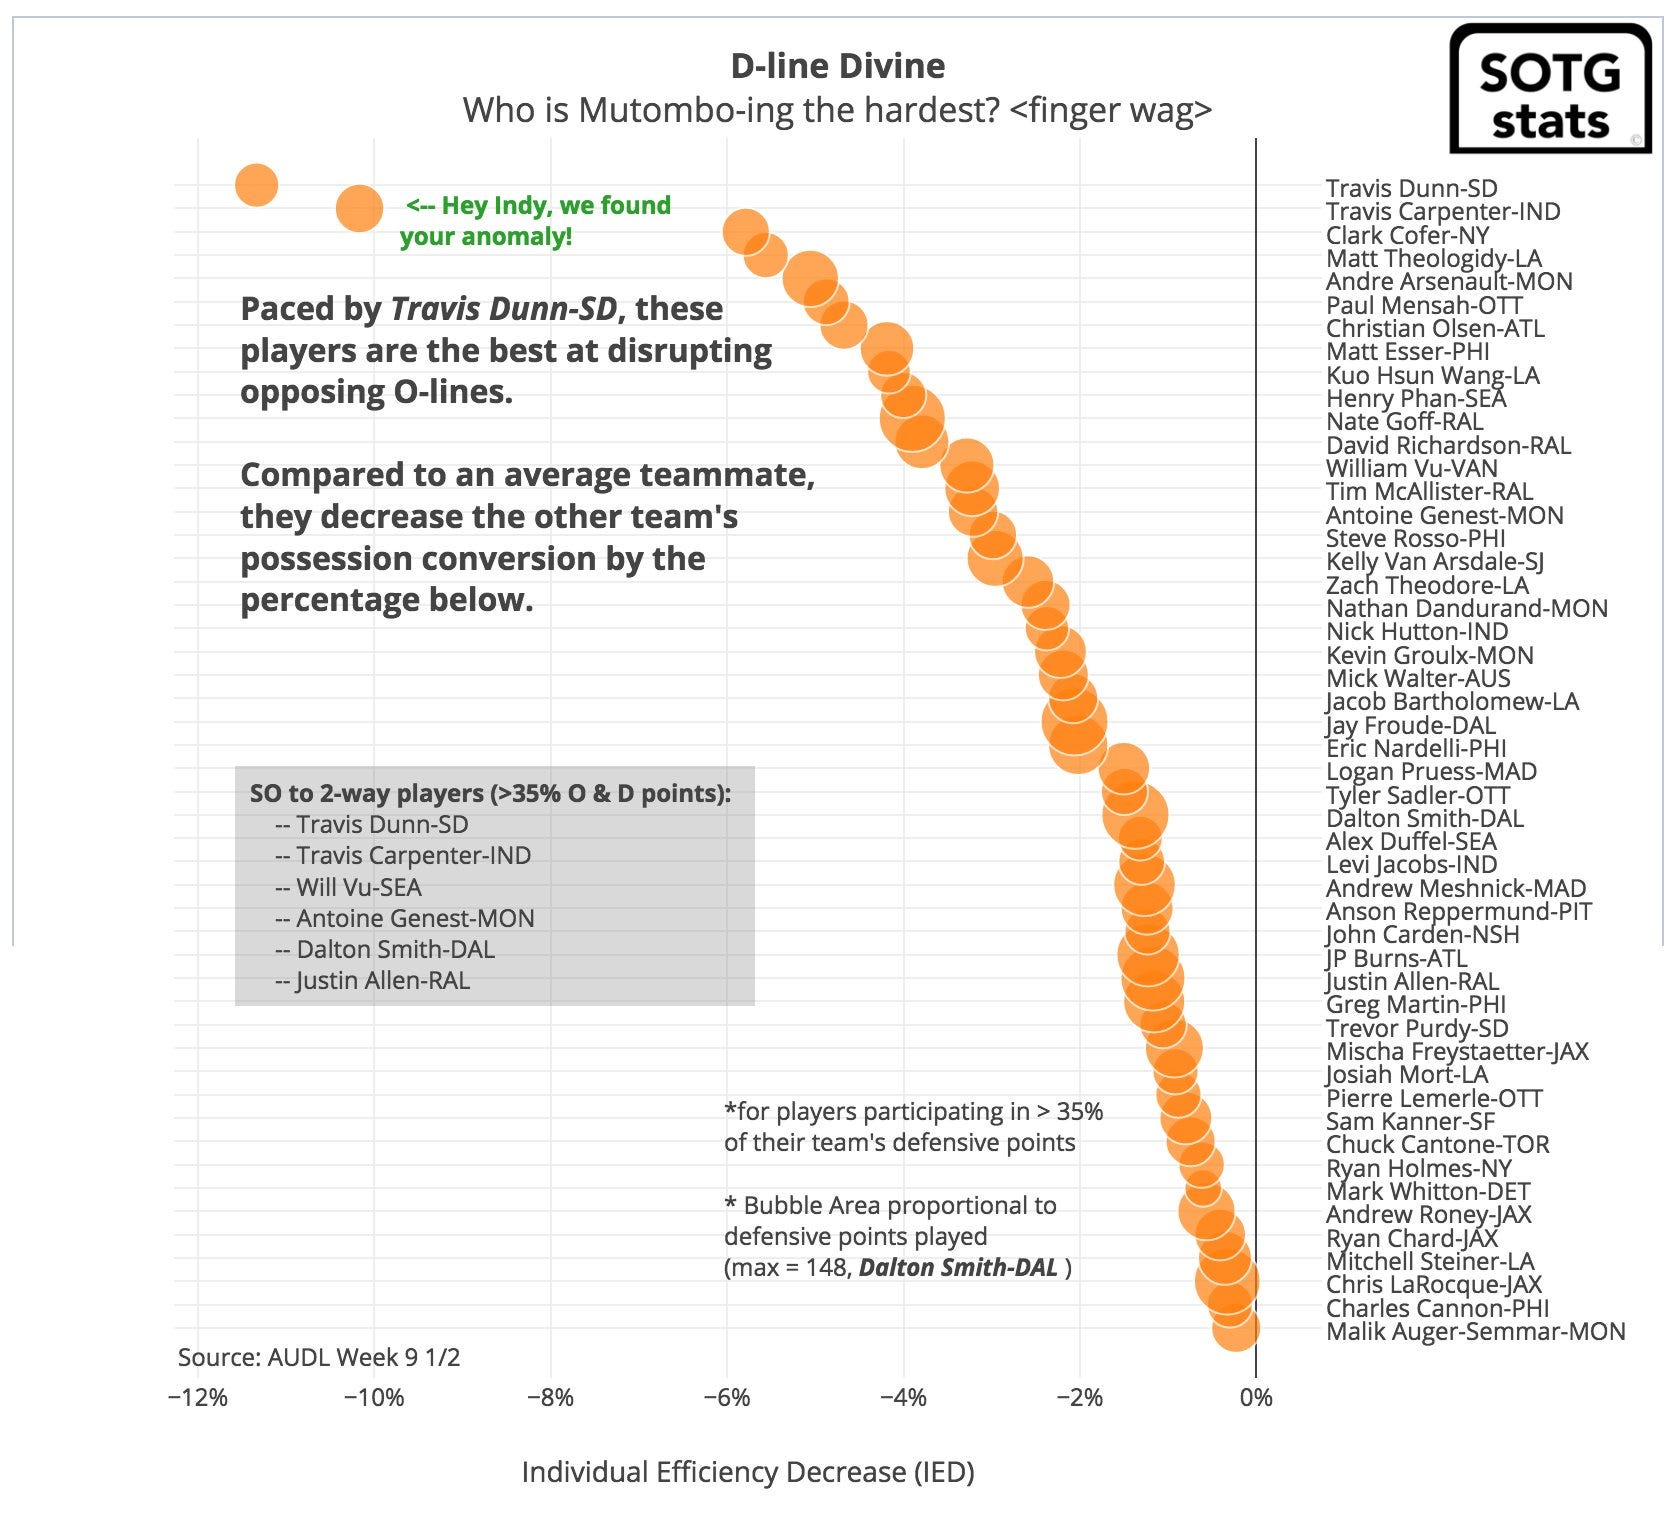
These are exactly the kinds of questions we should be asking! (Though I'm worried about sample size & confounders, and wouldn't necessarily take this data at face value)
Boston Glory data modeling challenge
Boston Glory ran a UFA data science competition in 2022 with a $1000 prize (see this tweet and this Google Doc). As far as I know, no results from this have been made public.
Better Box Score Metrics
Paul Würtztack's Better Box Score Metrics on Ultiworld has been running for a few years now, so it's almost certainly the most extensive producer of UFA data science content (known especially for its EDGE stat). Unfortunately the vast majority of the articles are behind a paywall, so I've never seen more than bits and pieces of Paul's work. But let's not forget about the real mystery: who is Paul Würtztack?
Eberhard, Miller, and Sandholz (2025)
[Update (2025-05-22): Their website shownspace.com is now live.]
A paper titled A Machine Learning Approach to Player Value and Decision Making in Professional Ultimate Frisbee, (direct link to PDF) (2025) was published recently, at the MIT Sloan Sports Conference in March 2025. From their abstract:
We use two primary models: 1) a Completion Probability (CP) model, which estimates the probability of a throw being successfully completed at any given target location, and 2) a Field Value (FV) model, which assigns positional value on the field as measured by scoring probability. We derive metrics from the CP model, FV model, and their combination that effectively evaluate player contributions, throwing performance, and team strategies. These metrics offer a data-driven approach to analyzing ultimate, establishing a more comprehensive understanding of the game.
I'm a little worried about their results that suggest one of the areas of highest completion probability are hucks to the back corner of the endzone:

Perhaps that's just an issue of low sample size. Or perhaps it's an actual good strategy that teams are underutilizing? Hmmm. (Or — I wonder how data is recorded for throws that were intended for the back corner but were inaccurate and sailed out of bounds?)
I like that they've calculated an "expected completion percentage" (quantifying who tends towards safer/riskier decisions) and an "Completion percentage over expectation" (who completes more of their passes than expected, given the difficulty of passes they're attempting). See the rightmost table:
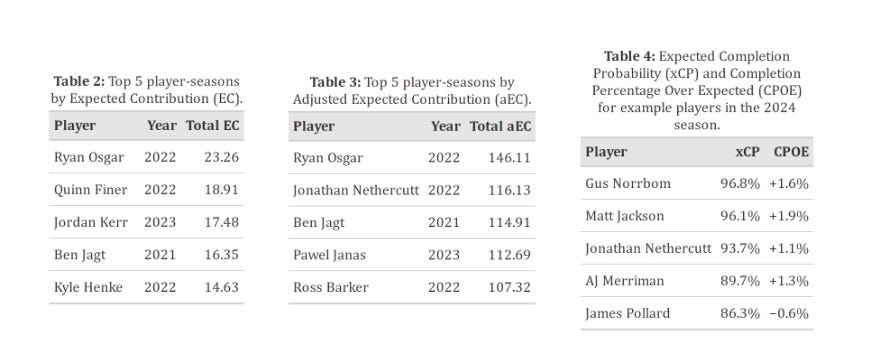
It seems like (but I don’t have definitive evidence) co-author Jacob Miller is the author of Analysis by Comet, above. (And a dashboard made by Braden Eberhard is linked further below)
[Updated 2025-04-24] Here’s the video of their presentation at the conference. With their permission I’ve also linked Braden’s GitHub project in the GitHub section below. Video:
NexGen
Although it's not semi-pro ultimate, detailed data was recorded for the 2012 NexGen tour, which provided the first1 spurt of "advanced analytics" in ultimate. Ultiworld has a page that links to the multiple NexGen posts on their site: The Statistics Of NexGen.
A few of the same authors of some of those articles—Jeremy Weiss and Sean Childers— had a paper published at the MIT Sloan Sports conference (Ultiworld press release here). That paper is: Spatial Statistics to Evaluate Player Contribution in Ultimate, Weiss and Childers. The original link to the paper hosted on the MIT site seems to be broken but I found a PDF of the paper, possibly a draft version, that you can read here. Here's a PDF of the conference poster.
The paper says it uses data from the "2013 club season"—it's not totally clear to me if that means it's from NexGen or from the USAU club series.
The paper references "Expected Contribution", which you can read more about on Ultiworld: Quantifying Player Value: Introducing ‘Expected Contribution’ And Ranking The 2013 NexGen Team (This article isn't included in the "Statistics of NexGen" link above, not sure why, maybe b/c it's from 2013, i.e. a year later?)
Weiss and Childers also published Maps for Reasoning in Ultimate (PDF) (2013) based on NexGen data.
David Zhang, a Harvard student, published a paper for a thesis project using NexGen Data: Ultimate Analytics: A study of elite teams' offenses, Zhang (PDF) (2015)
UFAStats
Formerly known as AUDLStats (that's a link to their no-longer-existing Twitter account, no need to click it). I didn't find anything too exciting scrolling through their last 1-2 years of Tweets. But of course the work they do actually recording the stats makes this all possible.
NBA x ultimate frisbee crossovers
A couple noted NBA stats guys have backgrounds in ultimate:
Chris Bubernak, who was a data analytics engineer for the Boston Celtics, played frisbee for Colorado Mamabird and was interviewed on a 2023 episode of Pod Practice.
Seth Partnow, author of The Midrange Theory and a former Milwaukee Bucks analytics employee, is a frisbee player as well — he mentions playing for Carleton CUT in the acknowledgements of The Midrange Theory ("I still think we would have taken any CUT team before or since and you can't convince me otherwise" he says of his Class of '99 team). I'm not aware of any ultimate frisbee-related work or interviews he's done.
A one-off project from 2021 posted on Bruins Sports Analytics ("UCLA's Student-Run Sports Data Science Organization") which involved creating an ultimate frisbee version of PER, an early "advanced stat" used in basketball:

Interactive Dashboards, etc
Online things you can play around with (if they still work).
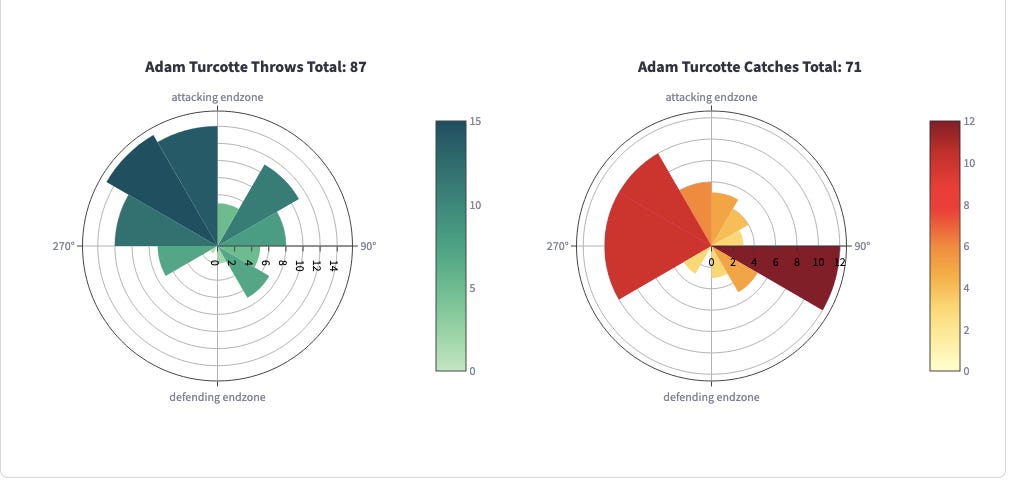
AUDL Dashboard by Braden Eberhard (Found from this Reddit post) Same author as the 2025 Sloan Sports paper linked above. It doesn't seem to be fully working anymore but some features are still available. The charts of where players are throwing to/catching passes from are pretty cool:

UltiMaps by Hiro Schmidt (see post on Reddit here) — Create heat maps for outcome (scoring probability, roughly). Based on data from the 2021 season. I'm not completely convinced on some of this data, for example the image below suggests attempting a pass 30 yards downfield can reduce your probability of scoring on a possession? (Perhaps it’s legit—maybe these passes are bad because there's often a stack in that location. Actually this is the same result we saw in the Eberhard et al paper, above. But it's also suggesting a dump pass 10 yards directly backwards is much worse than a dump pass 25 yards backwards and to the side):

InvertedPivot.com/AUDL — More heat maps of throw origin & destination. Seems to have data from 2021 and 2022.
yukikongju AUDL dashboard— (Found via Reddit) Data for 2021-2024. I haven't been able to get it to work.
AUDL Yearly Metric Analysis by Evan Miller. — Dashboard for visualizing basic team-level stats & how they've changed year-over-year.
UltiAnalytics had some AUDL data from 2014-2019 (see: "Featured: The AUDL 2019", etc, on their homepage)

GitHub
Code projects on GitHub. Not in any particular order. (Included simply as a resource for people who might be coding themselves—this section isn’t meant to be a fun read.)
https://github.com/pshriwise/AUDL_Server — "Contains python scripts for getting American Ultimate Disc League (AUDL) statistics information from the www.ultianalytics.com server." (Last update ~7 years ago)
https://github.com/zwrankin/audl-viz — "Interaction visualization of data from the American Ultimate Disc League — https://audl-viz.herokuapp.com/". I didn't list this dashboard in the section above b/c it seems to be completely dead. (Last update ~6 years ago)
https://github.com/yukikongju/audl — (Found via Reddit) "Unofficial AUDL api for python users... Generate pdf reports for player, team and games" (Last update this year)
https://github.com/ConradHougen/ufa_api — "Unofficial AUDL api for python users" (appears to be an offshoot/update of the yukikongju link right above this one. Not sure what's different exactly) (Last update last year)
https://github.com/dfiorino/ultianalyticspull — By Dan Fiorino, mentioned above. "Use UltiAnalytics Pull to grab, clean, and enhance ultimate frisbee data from UltiAnalytics. Run it over your team's data or use it to analyze the full available data sets of professional ultimate (both AUDL and PUL)." (Last update ~5 years ago)
https://github.com/BradenEberhard/Ultianalytics — Code for the Braden Eberhard AUDL dashboard linked above (Last update ~2 years ago)
https://github.com/jcweiss2/ultimate — Github for the 2012-13 NexGen project. Also links to a couple news articles covering their Sloan conference paper, in the Wall Street Journal and in 538. (Last update ~8 years ago)
https://github.com/yukikongju/AUDL-Dashboard — Code for the yukikongju AUDL dashboard, see above. (Last updated recently)
https://github.com/22ermiller/audl_stat_comp/ — "The purpose of this project is to explore basic performance trends over the last decade in the AUDL (American Ulimate Disc League)." Code for "AUDL Yearly Metric Analysis" dashboard, see above. (Last updated ~2 years ago)
[Edit 2025-03-27] Thanks to this Reddit comment for pointing out a few more:
https://github.com/marcwagn/ultimate_analytics
https://github.com/TeemuSailynoja/UltimatePlayerTracker
https://github.com/TeemuSailynoja/ulticlips
https://github.com/BradenEberhard/Expected-Throwing-Value/ — GitHub for 2025 Sloan Sports Conference paper discussed above.
API
The UFA API can be found at
https://www.docs.ufastats.com/
(formerly docs.audlstats.com)
A few data-science-adjacent quick hits
A post by John Randolph on what he'd like to see change about UFA statkeeping
A comment on Reddit suggested Jim Parinella's blog has some good stats-centric frisbee posts, though I haven't researched enough to tell you exactly which posts those are.
The Flip had some good stats-heavy posts on Medium around 2017-2018.
Amateur Statistics For Professional Athletes by Noam at The Breakside calculates “Game Score” for the Western Ultimate League (added 2025-03-26)
See comments below from Jim Parinella, Austin Cary, and Abi with a few more links (added 2025-03-26/updated further 2025-04-14)
[added 2025-04-24] This article by Matthew Hudson describes the creation of PER scores (for Australian Nationals), building on Ian Geertsen’s work (linked above).
as far as I'm aware
plugging my own work:
2018 - Regarding efficiency - https://afbcary.github.io/audl-stats/
2024 - UFA vs Club player participation - https://afbcary.github.io/ufa-usau/
I also haven't published this anywhere, but I want to improve on the strength of schedule published here: https://www.watchufa.com/league/news/2025-ufa-strength-schedule-breakdown. So I applied the glicko-2 rating algorithm, also used in chess, to UFA teams. The analysis isn't done but the plots of rating over time are interesting. https://github.com/Afbcary/power-rankings/tree/main/plot_pictures
My stuff was more "data art" than "data science".
https://parinella.blogspot.com/2011/03/i-got-comment-on-previous-thread-and.html
https://parinella.blogspot.com/2011/03/dorkapalooza-baby-dorkapalooza.html
https://parinella.blogspot.com/2006/10/ranking-algorithm.html
https://parinella.blogspot.com/2006/07/value-of-puller-warning-numbers.html
https://parinella.blogspot.com/2005/12/relative-value-of-o-and-d.html
https://parinella.blogspot.com/2005/10/fun-with-rri.html
https://parinella.blogspot.com/2006/01/whats-good-about-stats.html
There was an issue of The Huddle about stats as well but I can't find it.
Thanks for all the links. Can't wait to take a look at them all.