Tazio Torrieri emailed to point out that my discussion of "usage rates" in my recent article on player value was lacking, and he's totally right—I messed this one up. After looking into it further, I think my point still stands...more or less. It's less definitive than I'd originally assumed.
As a reminder, here's what I'd written about usage rates in basketball and frisbee:
Some NBA stars have a usage rate of 35-40%...
I doubt there are [ultimate frisbee] players that are directly involved in anywhere near 35% of their team's throws. This would be like a player getting the disc every third pass, every time they are on the field. (Sanity check: Last year, the LA Aviators had 3,685 total completions, while their star Pawel Janas led the league with 860 completions—23% of the team's total.)
Here's what Tazio told me via email:
You divided Janas completions by the team total completion to get the 23.3%. However, he could only touch the disc when on the field...
A rough (and maybe poor, see after) estimate could be using the playing time you mentioned earlier, for example the 70% which is one of the highest of the league ... 3685*0.7 = 2580, 860/2580 = 33.33% so, exactly one every third pass, sorry for your sanity :)
Nevertheless, this is probably overestimated too as Janas is more of an O-line player so he probably plays more points where completions happen, thus increasing the team completions when he's on the field...
Another factor is that...you should also add Janas' goals to his 860 completions...
...[and] some players don't play all the games of their team
He's totally right on the three sections I bolded—usage rate should only be calculated when a player is on the field (including adjusting for full games missed). It makes sense to include goals, too. I could have done this with a little more care!
Me and Tazio both forgot one other factor—the player's turnovers and the team's turnovers should both be included, too (as they are in the NBA).
Here’s my updated take on “usage rates”:
Completion ratio
It would be too much work to figure out exactly what percent of the Aviators' completions & turnovers happened with Janas on the field, so let's stick with that 0.7 factor as an estimate.
I'll call this the "completion ratio". Even though Tazio took the number from my estimation of playing time, what we're actually trying to estimate is the percent of the team's completions that happened with the player on the field.
As mentioned, players like Janas are playing less than 70% of the points, but because they're on the O-line, it's a reasonable guess that they're on the field for 70% of the completions.
Why do I say this? A few reasons. First, good AUDL offenses score on more than half of their possessions. So something like 50% of D-points involve no completions at all for the pulling team. No one in the top ten D-points played had over 200 completions—many had under 100 completions. In total, the 25 players with the most O-points played combined for 8284 completions. The 25 players with the most D-points played? 2049 completions. So perhaps its more like an 80%-20% ratio.
Second, I think it's safe to assume that:
there are more D-lines playing zone defense after pulls than there are O-lines playing zone defense after a turnover, and
Zone defense leads to more passes being thrown (especially by handlers)
We don't know exactly what percent of completions happen on offense, but 70% seems like a reasonable guess, if not too low.
Updated formula
Our new, better formula for usage rate looks like this:
(games played ratio)* (player's:completions + turnovers + goals ) / ((completions ratio)*(team's:completions+turnovers))
The "games played ratio" is the team's games divided by the player's games played. In effect, it scales up the players stats if they missed games.
Adding the further details doesn't change much in Janas's case—he didn't miss any games—so the new formula gives us the same result as Tazio calculated: Janas still has a "usage rate" of 33%.
What about other high-usage players?
There's something else I didn't mention in my last article: Janas led the league in completions by far.
He had 860 completions, while second place in the league, Brandon Van Deusen (who is also on L.A., oddly enough), had 657 completions. Fifth in the league, Duncan Fitzgerald of Austin Sol, had 567 completions.
Here are the "usage rates" for the AUDL players with the most completions in the 2023 season:
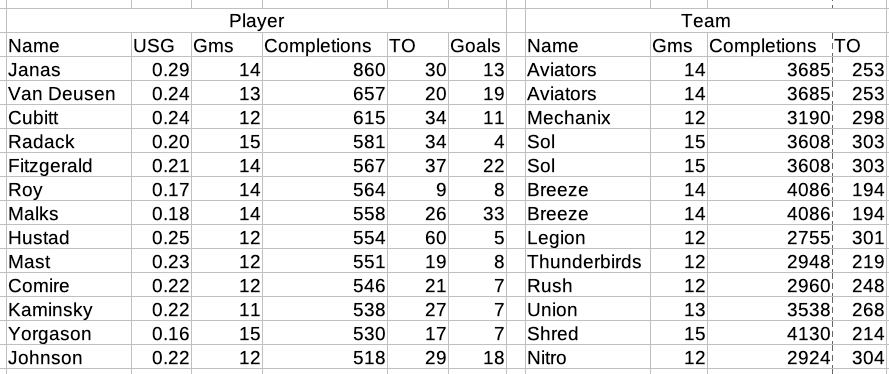
Remember that this is a table of the *usage rates of the players with the most completions*. It's not guaranteed to be a list of the *players with the highest usage rates*, because there may be a player with less completions but more goals, turnovers, or missed games. For example, Chicago’s Sam Kaminsky is much higher in the usage rankings than the completions rankings, mainly due to the two games he missed.
I used the same completion ratio, 0.7, for all players in this chart because they were all similarly skewed towards O-line points. Shout out to Cody Spicer who had 249 completions on 45 O-points and 202 D-points played. The players in the table above averaged 308 O-points and 10 D-points played.
So, this result is noticeably different from my original "sanity check": there are a number of players above 25%. Most of the list breaks down into two categories:
Pairs of high-usage teammates on good-to-great teams (Aviators, Sol, Breeze)
Main handlers on mediocre-to-bad teams (Nitro, Legion, Mechanix, Thunderbirds, Rush)
I'm not going to theorize about this today, but it seems interesting!
In conclusion, my sanity check wasn't great but we do still see higher usage for basketball stars: there are 17 players with a usage rate over 29% this year in the NBA (not counting outliers who only played a few games). I also think my simple method of calculating AUDL usage is an over-estimate compared to how the NBA does it, for reasons I'll explain in the next section.
This is a very rough estimate
I keep using scare quotes around the term "usage rate" because I want to stress that the number I'm calculating is definitely not equivalent to the data calculated by the NBA. There are a few issues:
First, we don't know exactly how many of the team's completions each player was on the field for. That completion ratio of 0.7 is doing a lot of work! If we bump it up to 0.8, to match the offense-to-defense completions ratio I calculated above, then the difference with the NBA gets correspondingly bigger. In that case, Pawel Janas and Dallas's Jason Hustad are the only players with "usage" above 25%.
Second, and perhaps more importantly, "usage" as a concept doesn't cleanly transfer to frisbee. Throwing a completion doesn't "use up" a team's possession in frisbee the way shooting a shot does in basketball. So this number can never be anything more than a very rough stab at what "usage" might look like.
To give a specific example, a handler facing a zone defense often throws lots of passes. They rack up lots of completions, but they're not really "using up" the team's opportunities by doing so, if they mostly throw short, wide open passes to another handler. In that sense these frisbee "usage rates" are inflated compared to the NBA's version of usage.
Another way to look at it: high-usage AUDL players had ~600 completions on 300-400 offensive possessions. In other words, all you'd need to do to lead the AUDL in this version of usage is to:
Catch every pull and pick up the disc after every turnover
Touch the disc one more time during the ensuing possession
The AUDL doesn't feel very star-centric when we look at it that way. Star NBA players are way more obviously the focal point of their offense, in my opinion. I expect this "pick up the disc" factor is helping inflate the AUDL rates.
Final thoughts
Although my calculation wasn't as thorough as it could have been, I think the point still stands—frisbee usage is lower than basketball usage, as we expect based on our intuition.
It's theoretically possible to figure out exactly how many of the team's completions a given player was on the field for, since AUDL game data includes point-by-point lineup data and pass-by-pass completion tracking (see here for an example game). However, that's a lot more work than I'm willing to go through.
This data could even be used to calculate a "with or without you" value, as mentioned in the last article. However, there's one big problem: these players play so many O-line points that we don't have a good sample size of "without you" data! In the NBA, even the best players sit throughout the game (and miss a couple weeks here and there due to injury), making these calculations much easier.
Anyways, thanks for sticking around to read all that. I'm looking forward to when the age of advanced data really arrives in ultimate frisbee.