

Grading my summer league predictions
How did I do?
At the beginning of the summer I posted my predictions for summer league. Let's take a look at how I did.
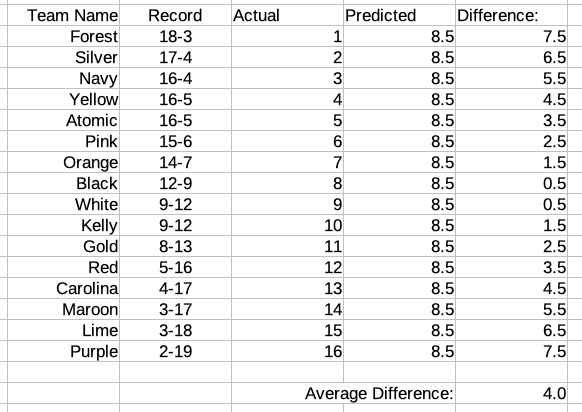
The image below shows the predicted and actual final standings:

I got 2 predictions exactly right; my worst prediction was off by seven; and most predictions were off by 2-5 spots. There was an average difference of 2.9 spots between where I predicted a team to finish and where they actually finished.
Well, how did I do?
So, did I do a good job predicting or not? In order to answer that question, we need some way to grade my predictions. We'll discuss a few ways of grading, starting with the very simple and ending with the more nuanced measures.
My first idea for grading my predictions was to compare them to a totally "naive" prediction. Say I had no idea which teams would be better than others. I could simply "predict" that every team would be equal, and finish tied for 8.5th place.
Using this method, two predictions would be off by 0.5 (the teams that finish 8th & 9th), two would be off by 1.5 (teams finishing 7th & 10th) .. and so on, up to the teams finishing in 1st and 16th whose predictions were off by 7.5. The average difference using this method would be 4.0.
In a way, this "ignorant" method is actually a pretty good prediction—you'll never get a prediction wrong by more than 7.5 spots. When you go out on a limb and predict a team to finish in 1st place, you're being vulnerable—opening yourself up to the possibility of being off by 15 spots. (This reminds me of the advice to invest in index funds because you're guaranteed to get "pretty good results" eve. My 401k is in index funds, but my frisbee predictions are just for fun—so I'm still going to try to "beat the market", so to speak.)
Using this "average error" metric, my 2024 predictions (average error of 2.9) were moderately more accurate than a totally naive prediction (average error of 4.0).
It's hard to say anything more exact than that I performed a bit better than chance. Is 2.9 much better than 4.0, or only a tiny bit better? The grade doesn't have any inherent meaning, so it's impossible to say. What would be better is to have other predictions to compare it against. Perhaps an average error of 2.9 is pretty bad, and all my friends could do better. Maybe next year I'll recruit a few friends to submit predictions alongside mine (like Ultiworld does in the Beat Charlie Challenge).
Compared to a simple Elo model
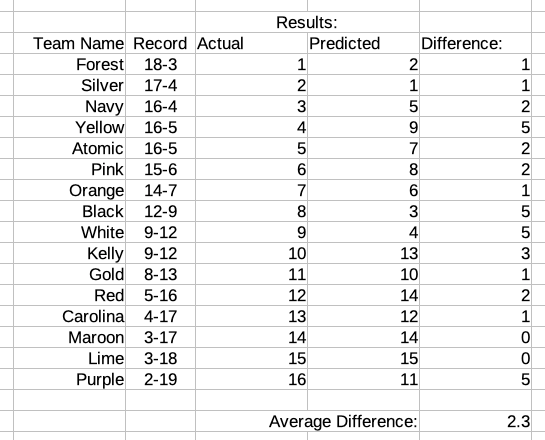
It turns out I actually do have one friend to compare against. Coincidentally, my friend Oliver has an Elo-based model to predict teams' strength based on the previous results of players on those teams. His 2024 predictions looked like this (he's better at making graphics than I am):
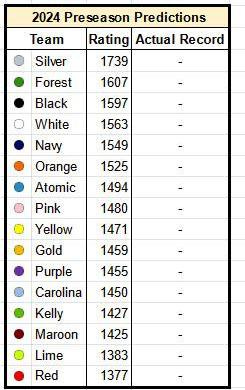
Our predictions were quite similar, although his model was closer on a few predictions, resulting in an average difference of 2.3, a bit more accurate than my predictions. (My worst prediction was off by 7 spots, with another off by 6. Oliver didn't have any off by more than 5.)
Other methods of grading
I used "average error" in the discussion above because it was the first strategy I thought of and it's easy to understand: "I said Black would finish in 3rd, and they finished in 8th; I was off by 5".
But is that actually the best way to grade this kind of prediction? I wasn't sure, so I asked in an open thread on Astral Codex Ten, a blog I like that sometimes has posts about the science of prediction. A few commenters were able to point me to other established ways of grading a rankings prediction.
One suggestion was to use the Spearman's rank correlation coefficient:
Another distance measure is Spearman's rank correlation coefficient. There, you take the vector of ranks for the true outcome (e.g., (1,5,4,3,2) might be such a vector for five teams), take the vector of your prediction, and compute the correlation coefficient between the two vectors.
Lucky for me, this calculation is available as a built-in function of the scipy library of the Python programming language. So I loaded my data into Python and tested it out:
import scipy
import numpy as np
import copy
Teams = ['Atomic','Black','Carolina','Forest','Gold','Kelly','Lime','Maroon',
'Navy','Orange','Pink','Purple','Red','Silver','White','Yellow']
Predictions = [5,3,9,2,13,12,16,14,10,1,8,11,15,4,6,7]
Results = [5,8,13,1,11,10,15,14,3,7,6,16,12,2,9,4]

scipy.stats.spearmanr(Predictions,Results)
The Spearman coefficient ranges on a scale from -1 (perfect negative correlation, this would mean the teams I predicted to be bad were good, and vice versa) to 1 (perfect correlation, i.e. if I got every prediction exactly right). A value of 0 would represent no correlation, i.e. my predictions being no better than random guessing.
The calculated correlation coefficient for my predictions is 0.71. Again, we can't really assign any meaning to this besides saying "I did a bit better than random chance".
Another suggested grading method was the Kendall Tau distance:
My personal favorite would probably be the Kendall tau distance. For that, you count how many pairs you ordered correctly (team A is before team B, and you predicted this order), minus the number of pairs you ordered incorrectly. The baseline, random guessing gives a score of zero in expectation.
I like this one because, like the "average error" I used at the beginning, it's intuitive: "I predicted Forest would be better than Carolina and I was right; I predicted Black to be better than Atomic and I was wrong".
The Kendall Tau distance is also available as a built-in scipy function, so I used it on my predictions as well:
scipy.stats.kendalltau(Predictions,Results)
Using the Kendall Tau measure, my predictions scored a 0.53. (Again values close to one represent strong agreement between predictions and results, values close to -1 represent disagreement).
I wanted to dig in on this one a little bit because I liked the intuitive nature of comparing pairs of teams. So I wrote some code to see how many pairs of teams I ordered correctly (please excuse my unprofessional coding):
def sign(num):
    return -1 if num < 0 else 1

Corrs=0
Incos=0
p=copy.deepcopy(Predictions)
r=copy.deepcopy(Results)
names=copy.deepcopy(Teams)
while len(p)>1:
    thisP = p.pop(0)
    thisR = r.pop(0)
    for compP,compR,compName in zip(p,r,names):
        order_p=sign(thisP-compP)
        order_r=sign(thisR-compR)

        if (order_p == order_r):
            Corrs+=1
        else:
            Incos+=1
print(Corrs,Incos)
In a 16-team league, there are 120 total pairs of teams. Going alphabetically, I can compare Atomic to 15 other teams, then I can compare Black to 14 other teams—leaving out Atomic because I've already done that comparison—and so on down until I get to the next-to-last team alphabetically, White, and the only team left to compare them to is Yellow.
For example, let's again take Atomic, since they're first alphabetically. I correctly predicted their results compared to 11 other teams (I correctly predicted them finishing better than Purple, Lime, Maroon, Carolina, Red, Gold, Kelly, White, and Pink; and correctly predicted them finishing worse than Forest and Silver). I got four predictions incorrect (wrongly predicted them finishing better than Navy and Yellow, wrongly predicted them finishing worse than Orange and Black).
All told, I ended with 92 correct pairwise predictions and 28 incorrect predictions.
Side note: 2023 results
Although I didn't publish any predictions on the blog for 2023, I did write them down and shared them with a few friends. In 2023, my predictions had an average error of .... 4.0, exactly as good as the "everyone's equal" method—no better than chance.

Oliver's model was also much worse in 2023, with an average error of 3.5 (vs 2.3 in 2024). We both had a team whose prediction we got wrong by 12 spots. And it was a different team for each of us — one of my top teams finished near the bottom; one of his bottom teams finished near the top.
My Kendall Tau score for 2023 was 0.32 (vs 0.53 in 2024), while my Spearman's rank coefficient was 0.42 (vs 0.71 in 2024). I correctly predicted 79 pairwise results, and incorrectly predicted 41 (92 & 28 in 2024).
These more advanced metrics show that, contrary to what I said above, even in 2023 my predictions were actually a bit better than "random chance". Using my "naive" prediction of every team finishing in 8.5th place isn't the best way to define the level of random chance. In fact, the Python commands to generate my scores throw an error message if I try to input a "prediction" of every team finishing in 8.5th. Yes, it's theoretically possible for every team to finish with the same record, but the Python functions don't see it as a valid ranking.
Oliver and I both were much more accurate in 2024 than in 2023. It seems 2024 was an especially predictable year—or perhaps 2023 was a surprisingly unpredictable year.
Oliver's model-based predictions have been consistently better than my "look at the rosters"-based predictions. Nice work, Oliver.
Strength of schedule
One concrete step I can take to improve next year is to do a better job considering strength of schedule. In our summer league, every team plays each of the other 15 teams once, and then plays 6 of those teams a second time. Given that my predictions were reasonably accurate, I think I could've made slightly better predictions by considering how teams have a differing "strength of schedule".
Strength of schedule is usually calculated using opponents' winning percentage, but for simplicity here, let's define it as the average (final) ranking of the opponents that your team plays twice. (A smaller number means you’re playing a harder schedule, since you’re playing twice against teams that finish near the top of the table.)
Let's look at a specific example. I had Yellow pegged as a good team, but towards the middle of the pack in 7th place. In reality, they finished fourth. The six teams they played twice were Purple (16th), Gold (11th), Lime (15th), Pink (6th), Red (12th), and White (9th), for a "strength of schedule rating" of 11.5.
I predicted White to finish one slot above Yellow, in 6th. I was off by 3 spots here too, as they finished 9th. White had a much tougher strength of schedule rating at 6.5, with repeated games against: Forest (1st), Silver (2nd), Kelly (10th), Maroon (14th), Black (8th), and Yellow (4th). (White & Yellow each won one of the two games they played against each other.)
Carolina, who finished 4 slots below my prediction of 9th place, also had an above-average-difficulty 6.2 SOS rating (facing off twice against teams finishing in spots 1, 2, 3, 7, 10 and 14)
I made this year's predictions simply by looking at each team's roster and trying to determine how I felt about it relative to other rosters. I think I can make my predictions slightly better in future years if I:
First, make a baseline prediction based only on rosters
Then, go back and refine slightly based on each team's projected strength of schedule.
Final thoughts
Overall, I'm pretty happy with how my predictions performed. With the randomness of summer league (injuries, vacations, all the new players who I know nothing about, etc), I think it would be mostly luck if I were to do much better in the future.
Check back in the future for more predictions.